Home Prices Rose in 71% of Metros as the Map Fractures
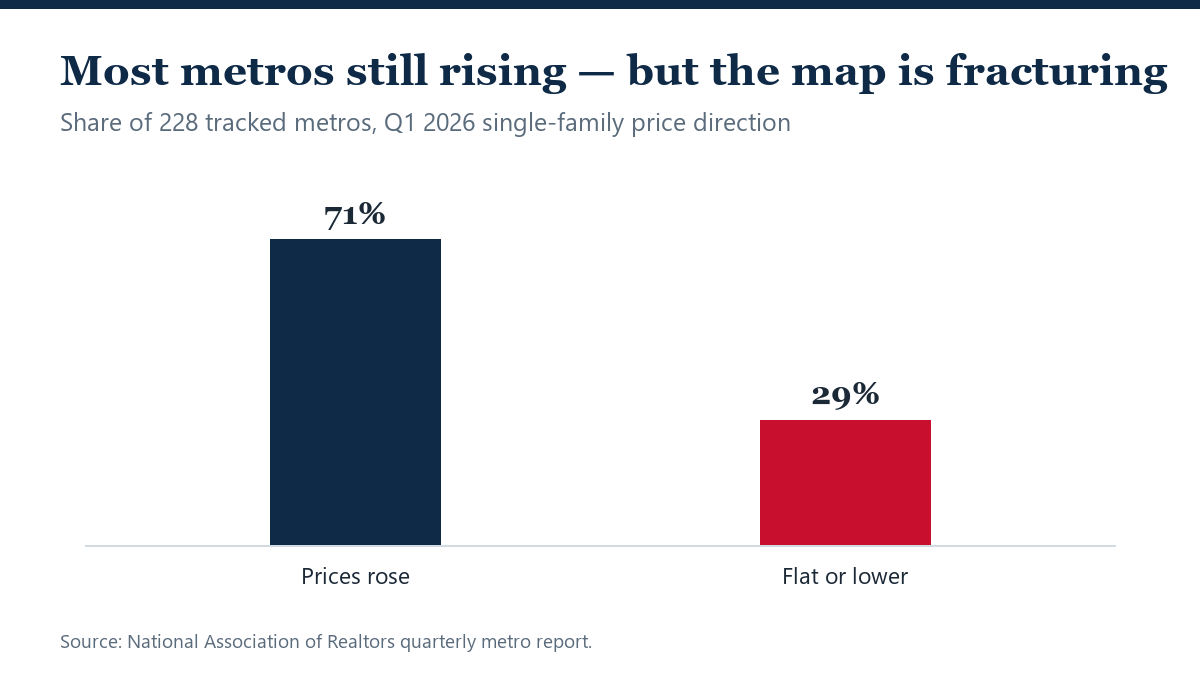
NAR: prices rose in 71% of metros in Q1 while nearly 29% went flat or negative — the most fragmented price map in years. San Jose tops $2 million.

NAR: prices rose in 71% of metros in Q1 while nearly 29% went flat or negative — the most fragmented price map in years. San Jose tops $2 million.
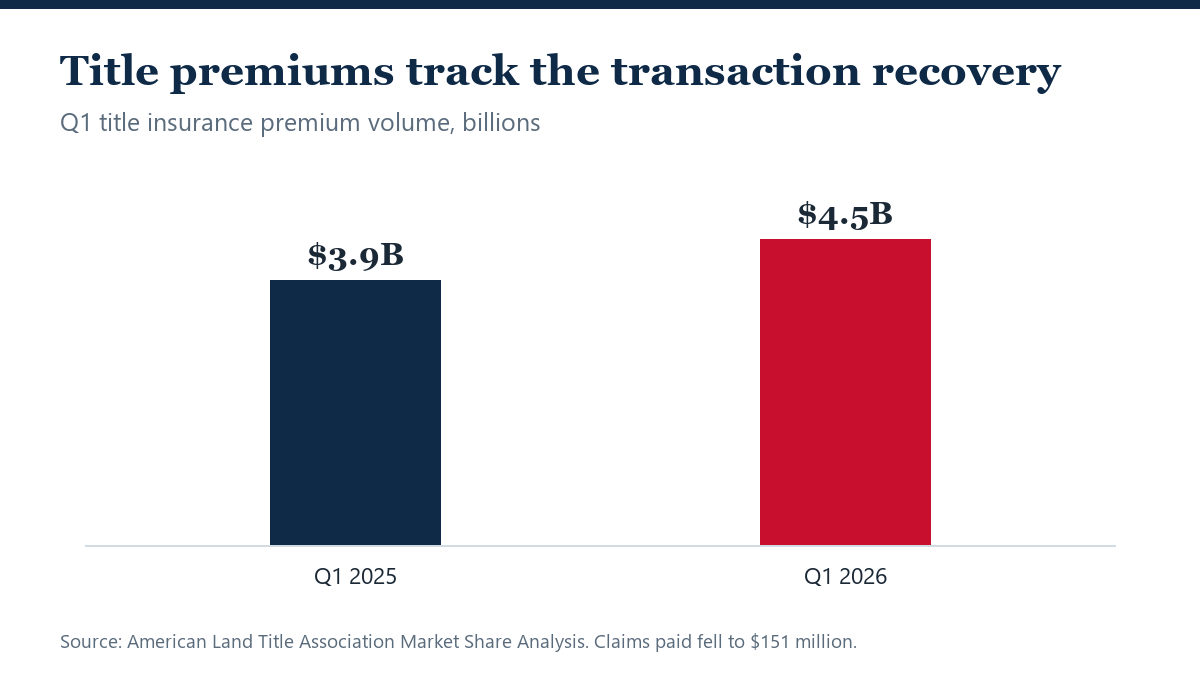
Title insurers wrote $4.5 billion in Q1 premiums, up from $3.9 billion, while claims fell — a clean confirmation that transaction volume is recovering.
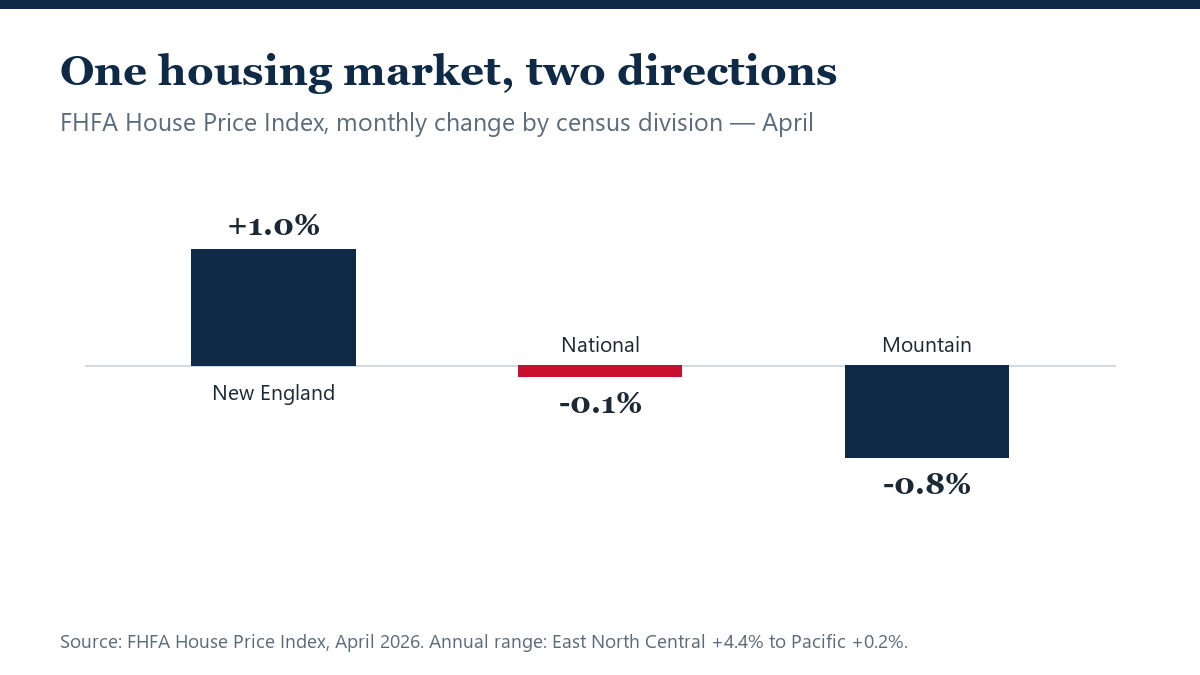
The FHFA index was flat in April — but regions ran opposite directions, from New England’s +1.0% month to the Mountain division’s -0.8% drop.
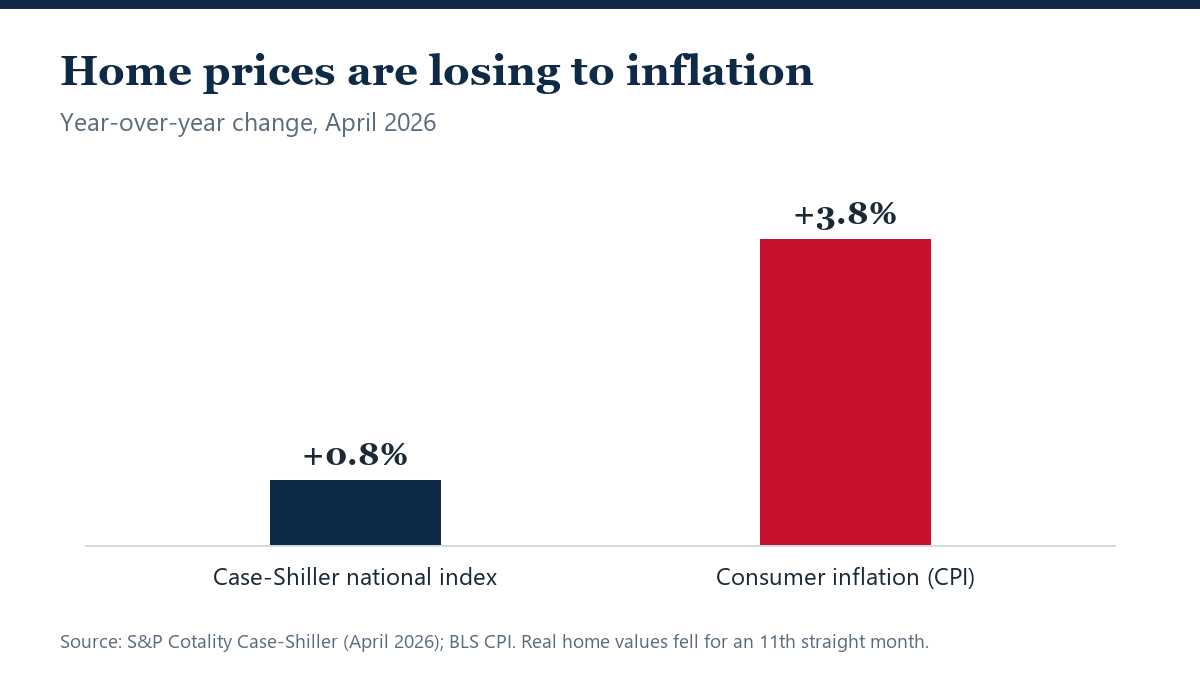
Case-Shiller shows prices up 0.8% in a year when inflation ran 3.8% — meaning inflation-adjusted U.S. home values fell for an 11th straight month.
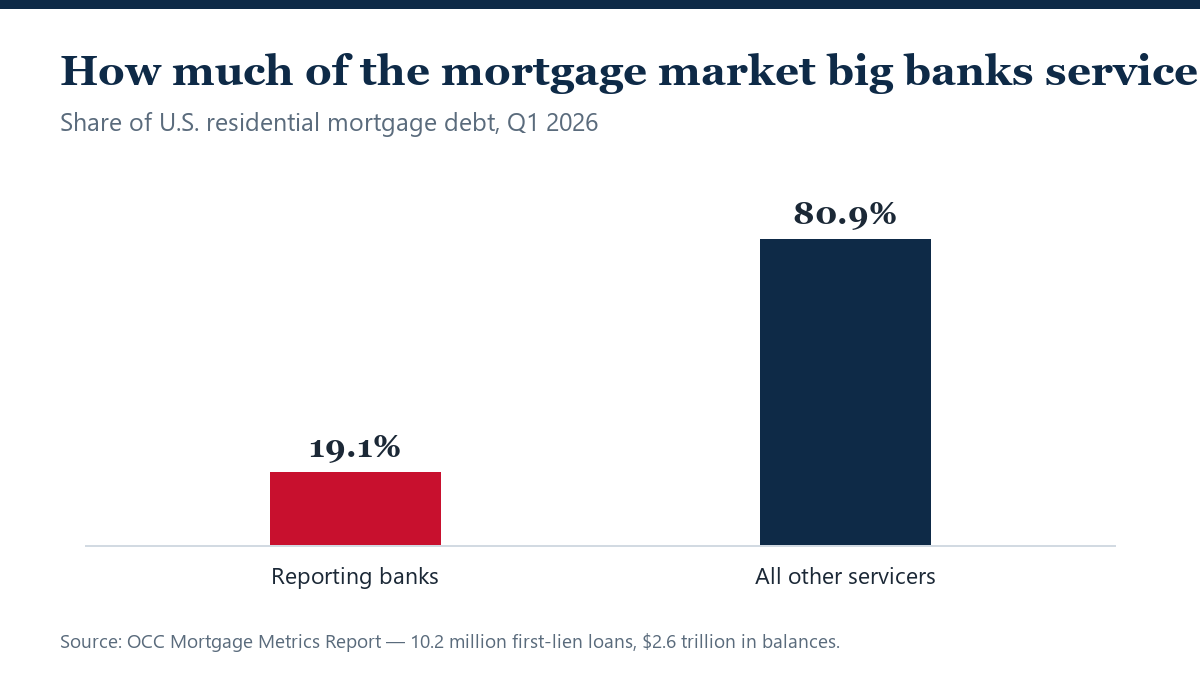
The OCC’s Q1 report tracks 10.2 million bank-serviced mortgages — $2.6 trillion, 19.1% of the market — the regulator-grade check on mortgage health.

Pending home sales rose in May 2026, but contract activity is only one signal. Here’s what buyers, sellers and agents should watch.

Are home prices falling in 2026? The latest data shows list prices are easing, but sale prices and home values tell a more mixed story.

How long does it take to sell a home in 2026? The answer depends on days on market, local demand, pricing and closing timeline.
Get expert insights, market updates, and new opportunities delivered to your inbox.