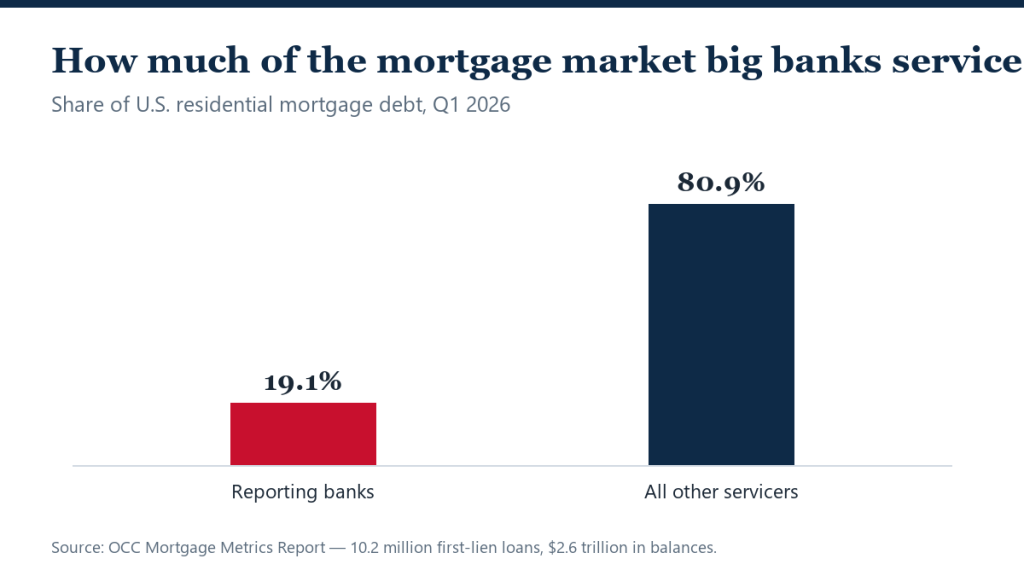
The OCC’s quarterly Mortgage Metrics Report offers something rare in housing data: a regulator’s direct view into how the nation’s largest banks’ home loans are actually performing. The first-quarter 2026 edition covers about 10.2 million first-lien mortgages with $2.6 trillion in unpaid balances — roughly 19.1% of all U.S. residential mortgage debt.
The report tracks the loans serviced by the large national banks the agency oversees — a window that matters less for its size than for its quality: performance, loss-mitigation and foreclosure data reported under examination-grade standards rather than survey estimates.
What the report covers
- Scope: approximately 10.2 million first-lien residential mortgages at reporting banks.
- Balances: $2.6 trillion in unpaid principal — about 19.1% of U.S. residential mortgage debt.
- Exclusions: junior liens, HELOCs and reverse mortgages; the sample is large but not statistically representative of the whole market.
- Contents: current-and-performing rates, delinquency trends, loss-mitigation actions and foreclosure activity, reported quarterly.
Why a bank-only window still matters
The mortgage market’s center of gravity moved to nonbank servicers years ago — which is precisely what makes the OCC’s bank slice useful as a control group. Bank-serviced books skew toward older, seasoned, often lower-rate loans held by borrowers who qualified under post-2010 standards; when stress appears here, it is stress that has burned through the market’s most protected tier. So far in 2026, the broader data pattern — foreclosure filings rising from historic lows without systemic distress — is consistent with what the regulator’s window shows.
The report also quantifies the machinery consumers rarely see: modifications, deferrals and workout plans that determine whether early delinquency becomes a pre-foreclosure or a cure. In a higher-for-longer rate era, that loss-mitigation capacity — not origination volume — is what separates a soft patch from a foreclosure cycle.
What it means
For homeowners, the takeaway is procedural: if payments become difficult, the servicer’s workout options are extensive and federally supervised — engage early. For investors and industry watchers, the OCC series is the quiet benchmark worth checking each quarter against headline-grabbing surveys; regulated data that moves slowly is exactly what you want to see stay boring. It has, so far.
Buried in the report’s own history is the industry’s biggest structural story. Two years ago, the same publication covered 11.3 million loans totaling $2.8 trillion — 21.3% of the national market. Today’s 10.2 million loans and 19.1% share mean the big banks’ servicing footprint shrank by more than a million loans in eight quarters, continuing the steady migration of mortgage servicing toward nonbank specialists.
That migration is why regulators watch this report alongside nonbank data rather than instead of it: the risk profile of the system now depends heavily on servicers that lack deposit funding and Federal Reserve access. The banks’ shrinking-but-pristine book is the system’s ballast; the growth is happening elsewhere, under different supervision.
For consumers, the practical footnote is that a mortgage’s servicer — who collects payments and manages hardship options — can change hands repeatedly over a loan’s life, and servicing transfers are a common source of escrow confusion. The OCC data is a reminder that whoever originates a loan, the odds it stays bank-serviced keep falling.
FAQ
Why does the OCC only cover 19% of the market?
It supervises national banks; most servicing now sits with nonbanks overseen by other regulators and the states. The report is a deep view of the bank-serviced slice, not a census.
Are bank-serviced mortgages safer?
They skew seasoned and prime, so they typically show stronger performance than the market overall — which is what makes deterioration in this data an early-warning signal.
Where can I read the report?
The OCC publishes it quarterly, with full tables, on its Mortgage Metrics page — no subscription required.