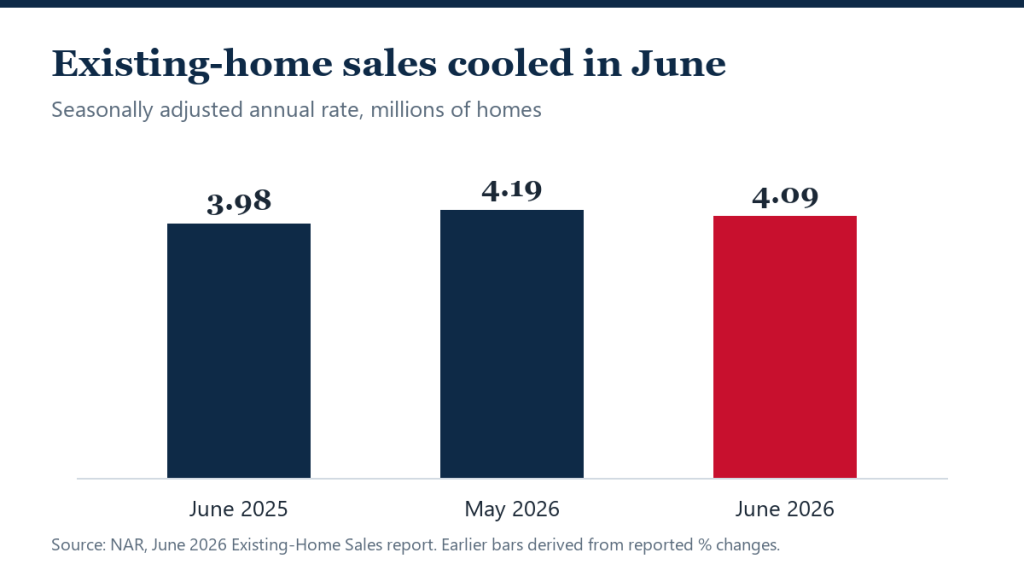
Existing-home sales fell 2.4% in June from the prior month, even as housing affordability posted its best readings in more than a year. Sales still ran 2.8% ahead of June 2025, reaching a seasonally adjusted annual rate of 4.09 million, according to the National Association of Realtors.
The report captures the housing market’s central tension in 2026: costs are finally moving in buyers’ favor, but demand keeps stalling every time mortgage rates tick upward. Sales rose in the Northeast, fell across the Midwest, South and West, and remained sensitive to week-to-week financing costs.
The June decline follows a stronger spring stretch, and it lands as housing inventory growth shows signs of stalling — a shift NAR warns could put renewed pressure on prices.
What the June numbers show
- Sales pace: 4.09 million seasonally adjusted annual rate — down 2.4% from May, up 2.8% from June 2025.
- Inventory: 1.56 million homes for sale, down 0.6% from May and up just 1.3% from a year ago — a 4.6-month supply.
- Median price: $440,600, an all-time high and up 1.8% year over year — the 36th consecutive month of annual price increases.
- Affordability: NAR’s Housing Affordability Index registered 102.3, up sharply from 95.5 a year ago, with improvement in every region.
The affordability improvement is real but fragile. Wage growth is currently outpacing home-price growth, which lowers the effective cost of ownership even with mortgage rates above 6%. Whether that continues depends heavily on where mortgage rates head next.
Rate-sensitive buyers keep stepping back
NAR Chief Economist Lawrence Yun attributed the monthly seesaw to financing costs. “The back-and-forth in monthly home sales activity, driven by mild fluctuations in mortgage rates, shows how sensitive home buyers are to affordability conditions,” Yun said, adding that job gains — more than half a million since the start of the year — should continue to support housing demand.
Yun also flagged the supply risk behind the price record: “The median home price has reached an all-time high. Even so, affordability is better than a year ago because wage growth is outpacing home price growth,” he said. “Without consistent gains in inventory, home prices can accelerate.”
A different story in each region
The national decline masks a split map. The Northeast was the only region where sales rose month over month, up 2.1% to a 480,000 annual rate, with a median price of $564,800 — up 3.9% from a year ago, the fastest regional price growth in the country.
Sales fell 3.0% in the Midwest (median $346,600, up 2.7%), 3.6% in the South (median $377,700, up 0.9%) and 1.3% in the West. The South remains the largest market at a 1.89 million annual pace, and its near-flat prices reflect the inventory build playing out across Sun Belt metros — the same pattern behind the uneven price declines showing up in national data.
Single-family holds up better than condos
Single-family sales fell 2.4% from May to a 3.73 million pace but stood 3.3% above a year earlier, with a median price of $446,400. Condos and co-ops were weaker on both measures: sales fell 2.7% from May and 2.7% from a year ago, at a 360,000 annual rate and a $380,000 median price, up 1.6%.
The condo softness matches the broader 2026 pattern: rising fees, insurance costs and special assessments are weighing on demand for shared-ownership housing even as detached homes hold their value.
What it means for buyers and sellers
For buyers, the affordability index reading above 100 means a median-income family can once again roughly afford a median-priced home at prevailing rates — a threshold the market spent most of the past three years below. The window is genuine, but June’s data suggests it may not stay open if inventory growth keeps slowing.
For sellers, a record median price is not blanket pricing power. Price growth of 1.8% is below inflation, regional gaps are wide, and the broader June housing data shows buyers remain quick to retreat when costs rise. Pricing to the local market — not the national headline — remains the difference between selling in weeks and sitting for months.
FAQ
Why did home sales fall if affordability improved?
Affordability improved compared with a year ago, but month-to-month swings in mortgage rates still move buyers in and out of the market. June’s decline followed a modest rate uptick; NAR expects continued job growth to support demand.
Is $440,600 really a record home price?
Yes — it is the highest median existing-home price NAR has recorded, and the 36th straight month of year-over-year increases. Adjusted for inflation, however, price growth of 1.8% trails the overall cost of living.
Is 4.6 months of supply a buyer’s or seller’s market?
It sits in between. Roughly six months of supply is considered balanced, so 4.6 months still modestly favors sellers nationally — but conditions vary sharply by region and price point.
Sources
- NAR — Existing-Home Sales Report Shows 2.4% Decrease in June
- NAR — Existing-Home Sales methodology and historical data