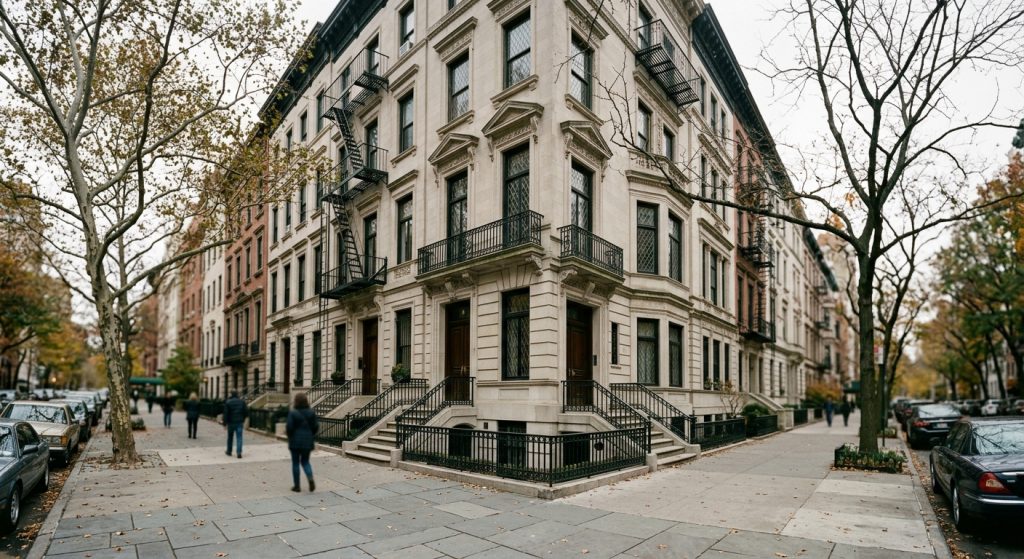
Manhattan closed 3,625 apartment sales in the third quarter, up 9% from a year earlier and the borough’s strongest third quarter since 2022, according to the quarterly market report Corcoran published Oct. 2. Dollar volume rose 10% to about $7.3 billion, the first time it has topped $7 billion since the third quarter of 2022.
The headline numbers describe a market being squeezed from the supply side rather than pulled by demand. Corcoran counted 6,354 active listings at the end of the quarter, 3% fewer than a year ago and what the brokerage called the thinnest third-quarter supply since 2017. New listings fell 6% to 3,469, a third straight annual decline.
New development is where the shortage bites
The sharpest contraction is in sponsor units — apartments sold directly by developers in new buildings. Corcoran put sponsor listings at 564 units, down 22% year over year to the lowest level since the fourth quarter of 2012, and the 13th consecutive quarterly decline.
Developers did bring more product to market than they did in the spring: buildings that launched sales in the third quarter accounted for 286 residences, up 4% from a year earlier and well above the 160 units launched in the second quarter. Corcoran’s assessment is that it was not enough to offset the shortfall.
That matters beyond the quarter’s statistics. New development pipelines take years to refill, and a 14-year low in sponsor inventory sets the supply conditions for 2027 and 2028 closings, not just for the current selling season.
Prices up for a seventh straight quarter
The median sale price rose 4% from a year earlier to $1.250 million, which Corcoran identified as a third-quarter record. Average price per square foot increased 2% to $1,751 and median price per square foot rose 5% to $1,420. All four of the report’s market-wide price measures rose year over year for the seventh consecutive quarter, the longest such run since 2016 by Corcoran’s count.
Resale condominiums carried much of that: sales climbed 15% to 1,266 and the median price set a record at $1.650 million. Resale co-ops were flat, with a median price unchanged at $875,000 — a reminder that Manhattan’s two ownership structures have not been moving together.
The top of the market is doing the work
Closings above $3 million jumped 25% year over year, led by a 40% surge in the $3 million to $5 million band. Sales below $3 million rose a comparatively modest 6%.
The mix shifted accordingly. Sales above $3 million made up 19% of the market, which Corcoran said ties an all-time high, while sales under $1 million fell to 42% — the second-lowest share on record, behind only the second quarter of 2019, when New York raised its mansion tax.
By neighborhood, Downtown and Midtown led. Downtown sales rose 21% and the Downtown median price rose 17% to $1.700 million; Midtown sales rose 22%. The East Side and West Side were roughly flat to slightly lower.
Contracts slipped, and deals closed faster
The forward-looking number was weaker. Signed contracts fell 6% year over year to 2,532, only the second annual decline in 10 quarters. The report attributes the pullback to higher mortgage rates, thin supply and the new pied-à-terre tax — the surcharge on New York City homes that are not the owner’s primary residence.
Buyers who did transact moved quickly. Contracts were signed after 90 days on market on average, two weeks or 13% faster than a year earlier and the fastest pace since 2022. It was the ninth straight quarter of year-over-year improvement in that measure.
Pamela Liebman, Corcoran’s president and chief executive, tied the two halves together in the report. “Manhattan’s third quarter results show a market with real underlying strength, even as buyers contend with higher borrowing costs and new policy headwinds like the pied-à-terre tax,” she said. “That tax is already adding another layer of uncertainty for buyers, particularly at the upper end of the market, and at a time when New York City should be focused on encouraging investment, not creating new reasons for people to pause.”
On supply, Liebman was blunter: “With available listings and new development inventory both near multi-year lows, buyers are competing for a shrinking pool of homes. Until we see new inventory come to market, limited supply will continue to support pricing and intensify competition for the city’s most desirable properties.”
Manhattan is diverging from the national picture
The figures in Corcoran’s report are the brokerage’s own, drawn from its view of Manhattan closings and contracts, and the firm has an obvious interest in how the market is read. Still, the direction of travel is notable against the rest of the country. Nationally, sellers have been giving ground: price cuts reached 20.8% of listings in September. Manhattan is running the opposite way, with falling listing counts and seven quarters of price gains.
The borough’s rental market has been telling a similar story about scarcity, with Manhattan rents reaching an all-time high in June. On our reading, the common factor in both markets is supply that is not being replaced, and the new-development numbers in this report suggest that condition has further to run on the for-sale side.
What is genuinely unresolved is the contract figure. One soft quarter of signings, after only one other annual decline in the previous nine quarters, is not a trend, but it is the first number in the report that points down, and it is the one worth watching in the fourth quarter. For more on how the rest of the country is behaving, see our housing market coverage.