America keeps renovating. The NAHB/Westlake Royal Remodeling Market Index came in at 61 for the second quarter — down a single point and comfortably in positive territory — even as 74% of remodelers reported supplier price increases averaging 6.7% since March.
The reading extends one of the housing economy’s most durable 2026 stories: owners locked into cheap mortgages are improving the homes they have rather than trading up, keeping renovation demand resilient while home sales sit near three-decade lows.
Inside the Q2 index
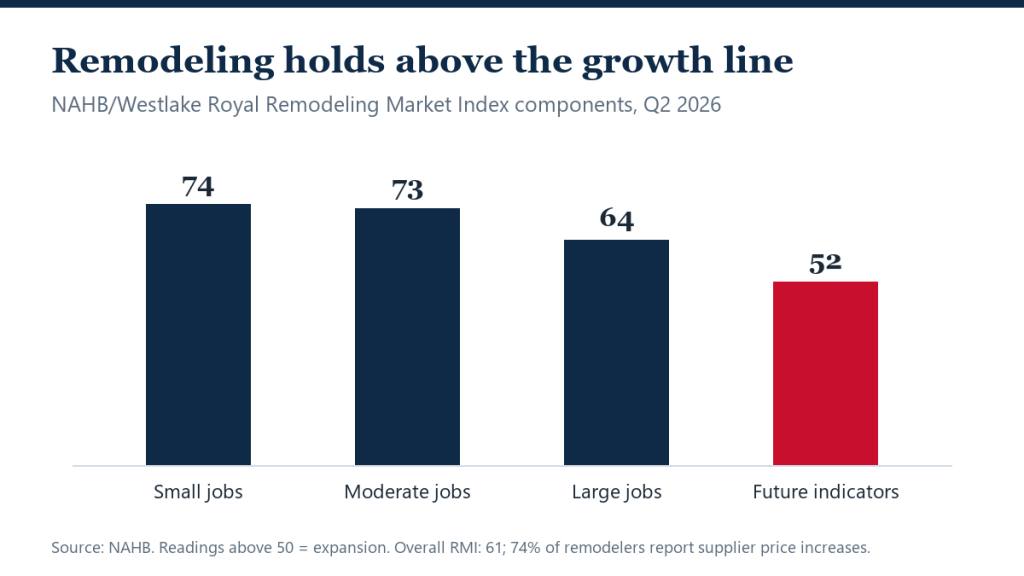
- Overall RMI: 61 (readings above 50 indicate expansion) — down one point from Q1.
- Current conditions: 70, unchanged — small projects (under $20,000) at 74, moderate projects at 73 (up four points), large projects ($50,000+) at 64 (down three).
- Future indicators: 52 — leads and inquiries at 51, backlogs at 54, both easing.
- Cost pressure: 74% of remodelers report supplier price increases since March, averaging 6.7%, attributed partly to higher fuel costs.
The rate-lock economy in one index
The composition tells the story. Small and moderate projects — kitchens, baths, repairs — are running hottest, while big-ticket jobs above $50,000 slipped: exactly the pattern of owners investing around a mortgage they refuse to give up rather than renovating for resale. With maintenance and improvement costs inflating 6.7% in a quarter, budgets buy less scope, pushing projects down-market in size even when demand holds.
The future-indicator softness (52) is worth watching rather than worrying: leads at 51 sit at stall speed, suggesting the remodeling boom is normalizing as some deferred-mover demand finally leaks back into a reviving sales market. Renovation and relocation are, at the margin, substitutes.
What it means
For homeowners, the practical read is on costs: materials inflation of 6.7% in four months argues for locking contractor bids early and expecting tighter change-order pricing. For sellers, remodeler backlogs at 54 mean pre-listing work still books out — plan pre-sale repairs months ahead, not weeks. For investors and agents, a 61 RMI alongside weak existing-home sales is the clearest measure of how much housing demand remains parked inside existing homes, waiting for a rate environment that lets it move.
NAHB attributed the material-cost surge partly to higher fuel costs — the same inflation channel that showed up in June’s consumer price data — and the timing squeeze is real: remodelers bidding jobs in March are eating a 6.7% input increase on work delivered in summer. Expect that gap to surface in firmer quotes and shorter bid-validity windows through the fall.
The index’s internals also map neatly onto the housing market’s freeze. Large-project softness (64, down three) tracks the disappearance of the renovate-to-sell pipeline while sales sit at three-decade lows; small-job strength (74) is the sound of owners maintaining homes they intend to keep for years. Remodeling is no longer a prelude to moving — it is the substitute for it.
Historical context helps calibrate: the RMI spent the pandemic boom in the high 70s and low 80s, so 61 represents normalization, not weakness. In an economy where new construction is throttling back, steady renovation demand is quietly doing some of the housing stock’s heavy lifting — keeping aging homes livable because replacing them has gotten so hard.
FAQ
What does an RMI of 61 actually mean?
The index is a diffusion measure: above 50, more remodelers report improving conditions than deteriorating ones. At 61, the sector is growing — modestly, not frothy.
Why are large projects lagging small ones?
Financing and confidence. Big renovations often lean on borrowing — costly at current rates — and owners uncertain about the economy start with smaller scopes. Cost inflation compounds the caution.
Will remodeling stay strong if home sales recover?
Partially. Some renovation demand substitutes for moving and would rotate back into transactions; the structural base — an aging housing stock needing repair — persists regardless of rates.