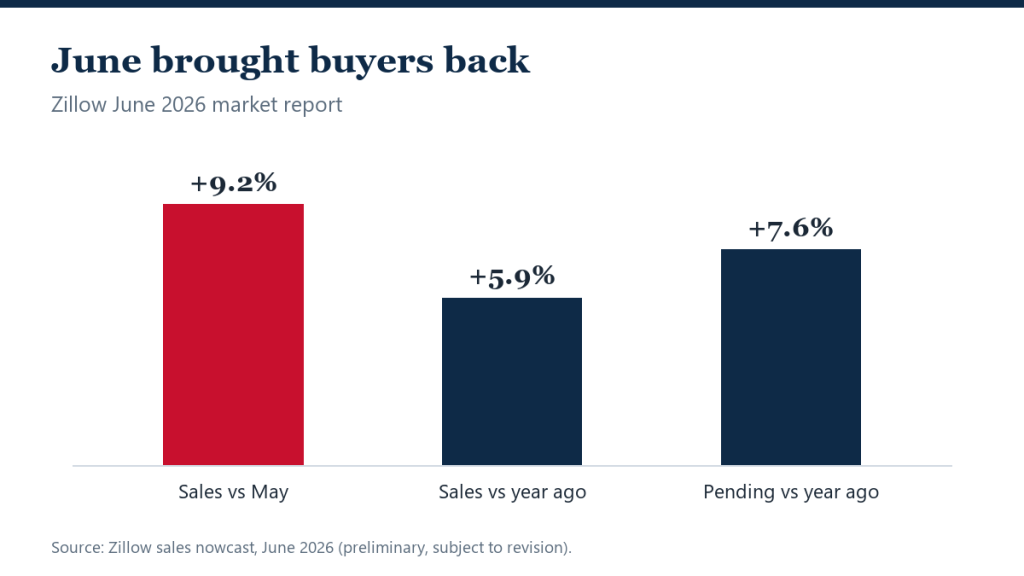
June gave the housing market its clearest sign of life this year. Home sales jumped 9.2% from May and 5.9% from a year earlier — 381,125 homes by Zillow’s preliminary nowcast — while pending sales rose 7.6% annually, the strongest demand signals in the company’s data since the spring of 2024.
But the report’s most consequential number points the other way: active inventory grew just 0.9% from a year ago, the weakest annual gain in more than two years. The buyer-friendly inventory expansion that defined the past 18 months is nearly over — demand is arriving just as the supply tailwind dies.
Zillow’s June report at a glance
- Sales: 381,125 (nowcast) — up 9.2% from May, 5.9% from a year ago.
- Newly pending sales: +7.6% year over year.
- Active inventory: 1.39 million — up just 0.9% annually, a two-year low in growth.
- New listings: 403,811 — up 3% from a year ago but down 4.6% from May.
- Competition: median 20 days to pending; 25.8% of listings had a price cut, fewer than a year ago.
The window that’s quietly closing
For two years, the buyer story was patience rewarded: more listings every month, more price cuts, more negotiating room. June’s data describes that trend exhausting itself — sellers are listing less (new listings fell 4.6% from May), fewer listings carry price cuts than a year ago, and demand is absorbing what arrives. It is the national version of what NAR’s inventory numbers and June’s record prices have been hinting: the market is tightening at the edges, not loosening.
Zillow’s rental data carries the same undertone. The typical rent reached $1,965 — up 2.2% annually on its index — even as 39.7% of rental listings offered a concession. Supply still buys renters perks; it is no longer buying them falling rents everywhere, a nuance alongside the asking-rent declines in other datasets that measure the market differently.
What it means
For buyers, June argues against indefinite patience: the combination of rebounding demand and stalling inventory growth is how leverage shifts back to sellers, gradually and then suddenly. For sellers who have been waiting out the soft market, rising sales with thinning competition is the signal many wanted — though the 25.8% price-cut share says overpricing still gets punished. As always, Zillow cautions its nowcast is preliminary and subject to mid-month revision.
The competition metrics sharpen the picture. Homes went pending in a median of 20 days — identical to a year ago, ending the streak of steady slowing — while 25.8% of listings carried a price cut, down from 26.6% last June even as the share ticked up seasonally from May. And 30.3% of May sales closed above list price. None of those are hot-market numbers; all of them have stopped moving in the buyer’s direction.
The rental side of the report tells a related story: Zillow’s observed rent index reached $1,965, up 2.2% year over year and accelerating slightly month over month, while nearly 40% of rental listings offered concessions. Zillow’s repeat-rent methodology captures what tenants actually pay, which is why it can rise while asking-rent trackers fall — landlords are discounting the sticker, not the renewal.
Zillow’s next report lands August 5 — the one to watch, since it will show whether June’s demand pop was a rate-dip blip or the start of the tightening the inventory data implies.
FAQ
Why do Zillow’s sales numbers differ from NAR’s?
Zillow nowcasts from MLS listing-status changes in near-real time; NAR surveys closed transactions on a lag. Levels differ, directions usually agree — and both showed June demand firming.
Is the buyer’s window really closing?
It is narrowing, not slammed shut. Inventory remains far above 2021–2022 lows, and a quarter of listings still take price cuts. But the trend — demand up, supply growth stalling — favors sellers if it persists.
What should renters take from this report?
Concessions remain widespread (nearly 40% of listings), so negotiate — but Zillow’s measured rents are rising again, suggesting the deepest rent softness may be behind the largest markets.