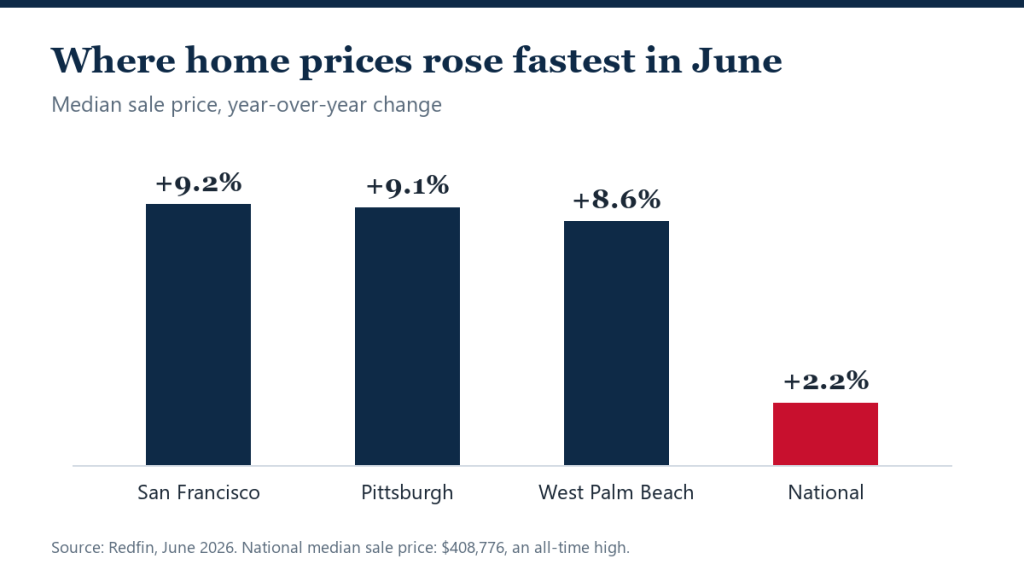
The median U.S. home-sale price climbed 2.2% year over year to $408,776 in June — an all-time high — even as buyers gained negotiating room in much of the country, according to Redfin. The record arrived alongside the strongest sales pace in more than three years: existing-home sales ran at a seasonally adjusted annual rate of roughly 4.4 million, the highest since November 2022 by Redfin’s measure.
The seeming contradiction — record prices in a market widely described as buyer-friendly — resolves once the gains are broken apart. June’s increase was concentrated in a handful of wealthy coastal metros and in higher-priced transactions, while much of the map stayed flat or fell. It is the same split visible in the divergence between list prices and sale prices that has defined 2026.
What the June data shows
- Median sale price: $408,776, up 2.2% year over year — a record.
- Sales pace: about 4.4 million (seasonally adjusted annual rate), up 0.1% from May and 4.2% from a year ago — the strongest since November 2022.
- Pending sales: up 4.5% year over year, the highest June level since 2023.
- New listings: down 1% from May to the lowest level since December.
Redfin’s sales estimate runs hotter than the National Association of Realtors’ count — the two use different methodologies — and the gap is a useful reminder to treat any single month’s housing data as one reading among several. NAR’s own June report showed sales slipping 2.4% from May on its measure, even as both sources agree prices set records.
Wealthy coastal buyers are doing the lifting
San Francisco led the nation with a 9.2% year-over-year jump in its median sale price, followed by Pittsburgh at 9.1% and West Palm Beach at 8.6%. San Francisco and West Palm Beach also posted closed-sales increases of roughly 23% — by far the largest among major metros — and San Francisco’s pending sales rose 16.4% to their second-highest level in four years.
Redfin ties both surges to the top of the market: technology wealth in the Bay Area and tax-driven migration of executives and investors into South Florida. A separate Redfin analysis found luxury prices rising three times faster than the rest of the market — and in San Francisco and West Palm Beach, that luxury demand is strong enough to move the entire metro’s median.
What it means for buyers and sellers
For most buyers, the national record is less relevant than local conditions: with new listings at their lowest level since December, well-priced homes in supply-constrained metros are moving, while overbuilt Sun Belt markets still favor negotiation. For sellers outside the coastal wealth centers, June’s data argues for realistic pricing — the national median is being pulled up by a narrow set of expensive markets, not broad-based appreciation.
The record also carries a supply warning. Falling new listings mean less selection heading into late summer, which could firm up prices even in markets that currently favor buyers — a dynamic that cuts against the inventory build seen earlier this year.
There is also a composition effect inside the record. With luxury transactions growing fastest — and West Palm Beach and San Francisco sales up roughly 23% — part of June’s median gain reflects which homes sold, not just what identical homes are worth. Repeat-sales indexes like Case-Shiller, which strip out mix shifts, have been showing far more modest appreciation, which is why a record median and a soft underlying market can both be true at once.
The practical rule for July: verify your own metro’s direction before borrowing the national narrative. The spread between a San Francisco (+9.2%) and the average Sun Belt metro is now wide enough that national headlines describe almost nobody’s local market accurately.
FAQ
Why did prices hit a record if buyers have leverage?
Because the gains are concentrated. A few wealthy metros — led by San Francisco, Pittsburgh and West Palm Beach — and a rising share of high-priced sales pulled the national median up, while many markets stayed flat or declined.
Whose sales numbers are right — Redfin’s 4.4 million or NAR’s 4.09 million?
Both. Redfin publishes a near-real-time estimate built from MLS data; NAR publishes a slower, survey-based count. They differ in level but usually agree on direction, and both showed prices at records in June.
Is this a good time to sell?
It depends on the metro. Sellers in coastal, supply-tight markets have genuine pricing power; sellers in the softer Sun Belt markets are competing against rising inventory and should price to the local data, not the national headline.