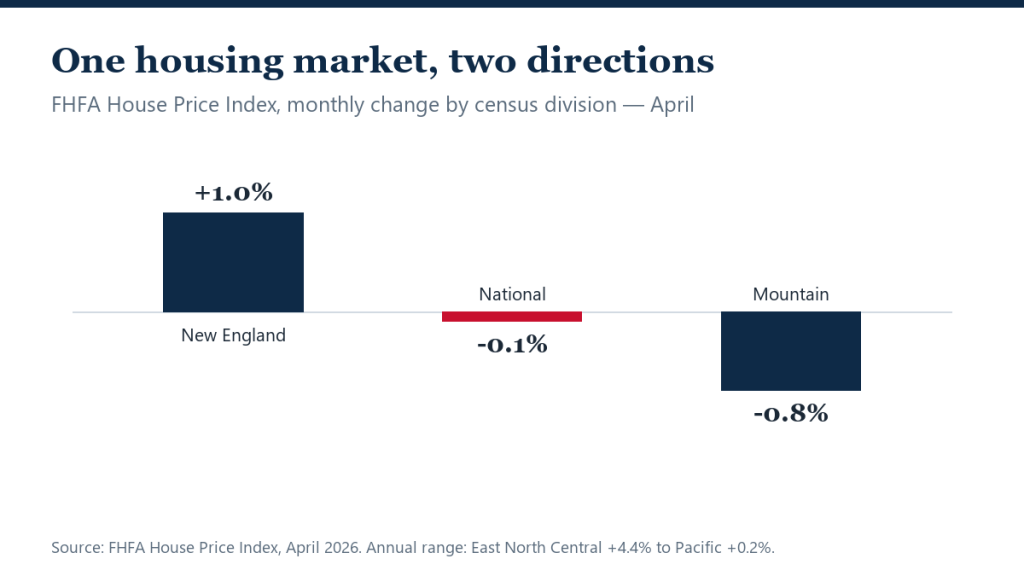
The nation’s official house-price gauge barely moved in April — down 0.1% from March, seasonally adjusted, and up 2.0% from a year earlier, the Federal Housing Finance Agency reported. The flat national number is the least interesting thing in the release: beneath it, America’s regions are running in opposite directions.
Across the nine census divisions, monthly changes ranged from +1.0% in New England to -0.8% in the Mountain division. Over twelve months the spread is wider still: prices rose 4.4% in the East North Central division — the Great Lakes states — while the Pacific division eked out just 0.2%.
April’s FHFA index at a glance
- National: -0.1% month over month (seasonally adjusted); +2.0% year over year.
- Monthly range: New England +1.0% to Mountain -0.8%.
- Annual range: East North Central +4.4% to Pacific +0.2%.
- Revision: March’s reading was revised up from +0.1% to +0.2%.
The supply map explains the price map
The FHFA data — built from Fannie Mae and Freddie Mac purchase mortgages — lands on the same split every 2026 dataset keeps finding: the supply-starved Northeast and Midwest posting real gains while the West and Mountain states, where inventory recovered fastest, give ground. It is the FHFA’s version of the divergence in whether home prices are actually falling — nationally flat, locally emphatic.
A +2.0% annual gain also trails inflation, which ran 3.8% in April — putting the official government index in agreement with Case-Shiller that real, inflation-adjusted home values are declining even as nominal records grab headlines.
What it means
For buyers and sellers, the index is a reminder to price against the right map. A Mountain-division seller pricing off national headlines will overshoot a falling market; a New England buyer waiting for the national softness to arrive locally may wait indefinitely — supply there remains too tight. For owners, +2.0% annual appreciation still compounds equity, just more slowly than the cost of everything else.
The index’s construction explains part of its restraint. FHFA builds it exclusively from purchase mortgages backed by Fannie Mae and Freddie Mac — no cash transactions, no jumbo loans. That excludes precisely the luxury and cash segments currently lifting median-price measures to records, which is why the official government gauge reads +2.0% while median trackers celebrate all-time highs. Neither is wrong; they are watching different buyers.
The March revision — from +0.1% to +0.2% — cuts against reading April’s dip as the start of a slide. Monthly readings this close to zero are noise around a flat trend: national prices have effectively moved sideways since winter, with the regional extremes doing all the work.
For the Mountain division, April marks another month in a now year-long pattern. Phoenix, Denver and Salt Lake City combined pandemic-era run-ups with the country’s most productive construction pipelines, and both forces are still unwinding. The division’s -0.8% monthly drop is the sharpest of the nine — but even there, the decline remains orderly rather than disorderly.
FAQ
How is the FHFA index different from Case-Shiller?
FHFA uses purchase prices from mortgages backed by Fannie Mae and Freddie Mac — so it excludes cash deals and jumbo loans. Case-Shiller casts a wider net. They usually agree on direction, and both currently show roughly 1–2% annual growth.
Why is the Mountain division falling?
Boomtown math. Metros like Phoenix, Denver and Salt Lake City saw huge pandemic run-ups and aggressive construction; recovered inventory is now pulling prices back toward incomes.
Is +2.0% a healthy number?
It is a cooling number — below inflation and below wage growth. That is bad for short-term equity building but genuinely good for affordability, which improves whenever incomes outrun prices.