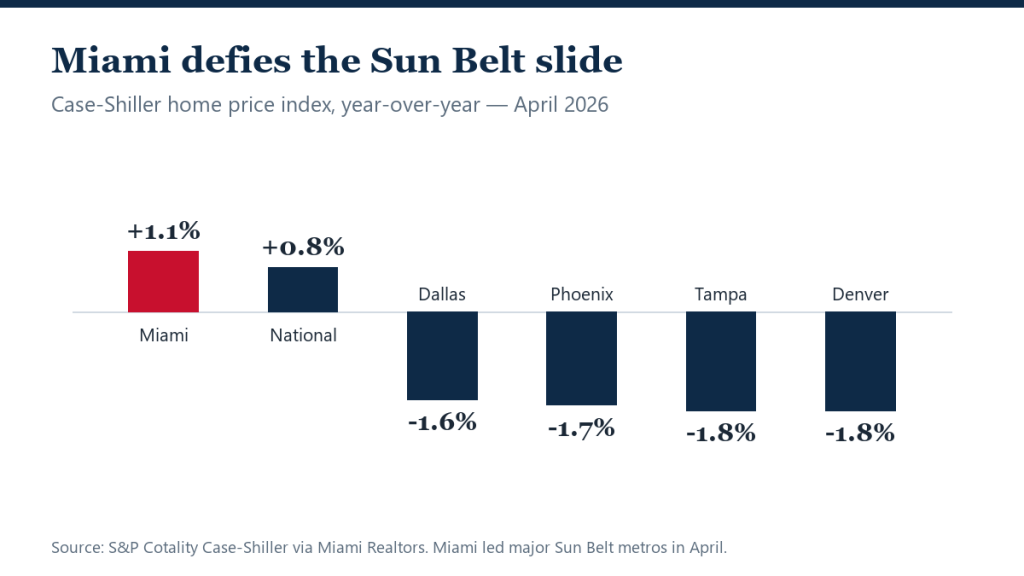
The Sun Belt’s post-boom hangover has a conspicuous exception. Miami home prices rose 1.1% year over year in April on the S&P Cotality Case-Shiller index — ahead of the 0.8% national gain — while fellow boomtowns went the other way: Dallas fell 1.6%, Phoenix 1.7%, and Tampa and Denver 1.8% each, according to an analysis highlighted by the Miami Association of Realtors.
Same region, same rate environment, same construction cycle — opposite outcomes. The split is the cleanest demonstration yet that 2026’s housing story is written metro by metro, not region by region.
April’s Sun Belt scoreboard
- Miami: +1.1% year over year — fastest among major Sun Belt metros.
- National index: +0.8%.
- Dallas: -1.6%; Phoenix: -1.7%; Tampa: -1.8%; Denver: -1.8%.
Why Miami holds while Tampa slides
Supply and buyer mix. Texas, Arizona and Central Florida built aggressively into the boom and are now digesting it; coastal South Florida’s land constraints kept its pipeline thinner. Demand differs too: Miami draws international capital — foreign buyers concentrate heavily in South Florida — plus wealth migration that keeps its luxury tier liquid, the same top-end strength Redfin found lifting entire metro medians.
The caveat: a 1.1% nominal gain still trails inflation, and Miami’s ownership costs are their own headwind — insurance, condo assessments and association fees have repriced sharply, per Florida’s 2026 condo and insurance rules. Miami is outperforming its peers, not escaping the cycle.
What it means
For buyers, the map matters more than the region: Tampa’s -1.8% market rewards patience and negotiation; Miami’s +1.1% market does not. For sellers, Miami’s edge is real but thin — price like it is 2026, not 2021. For investors, the divergence argues for underwriting each metro’s supply pipeline rather than buying “the Sun Belt” as a theme.
Miami’s resilience shows up beyond the repeat-sales index. Redfin’s June data put neighboring West Palm Beach among the national leaders with prices up 8.6% and closed sales up roughly 23% — different index, different month, same story of South Florida wealth demand refusing to follow the inland Sun Belt down. The region’s luxury tier — where Miami prices rose 14.2% on Redfin’s measure — keeps doing disproportionate work.
The bear case is carried costs rather than prices. Florida’s insurance repricing, new structural-reserve requirements and rising association fees hit fixed monthly costs hardest — and they compound the longer a building’s assessments were deferred. A Miami condo that gained 1.1% in value while its carrying costs rose double digits did not get cheaper to own; single-family homes on fee-simple lots dodge most of that math, which is partly why they lead the metro’s strength.
April also extends a two-year pattern worth naming: every cycle of Sun Belt softness has sorted the region’s metros by supply elasticity. Markets that can sprawl — Dallas, Phoenix, inland Florida — reprice; markets pinned between ocean and Everglades hold. Geography, not vibes, is the moat.
FAQ
Why is Miami rising while Tampa falls?
Tighter supply, international demand and a stronger luxury segment. Tampa built more and depends more on rate-sensitive domestic buyers.
Is 1.1% growth actually good?
Relative to peers, yes; in real terms, no — it trails inflation, so Miami owners are roughly holding value while Dallas or Tampa owners are losing modestly in both nominal and real terms.
Does this mean Florida housing is safe?
Florida is not one market. Miami’s coastal scarcity behaves differently from Tampa’s or Orlando’s supply-heavy inland corridors — and rising insurance and association costs pressure every Florida owner regardless of price direction.
Sources
- Miami Realtors — Miami metro price growth is fastest in the Sun Belt
- S&P Dow Jones Indices — Case-Shiller April 2026 results