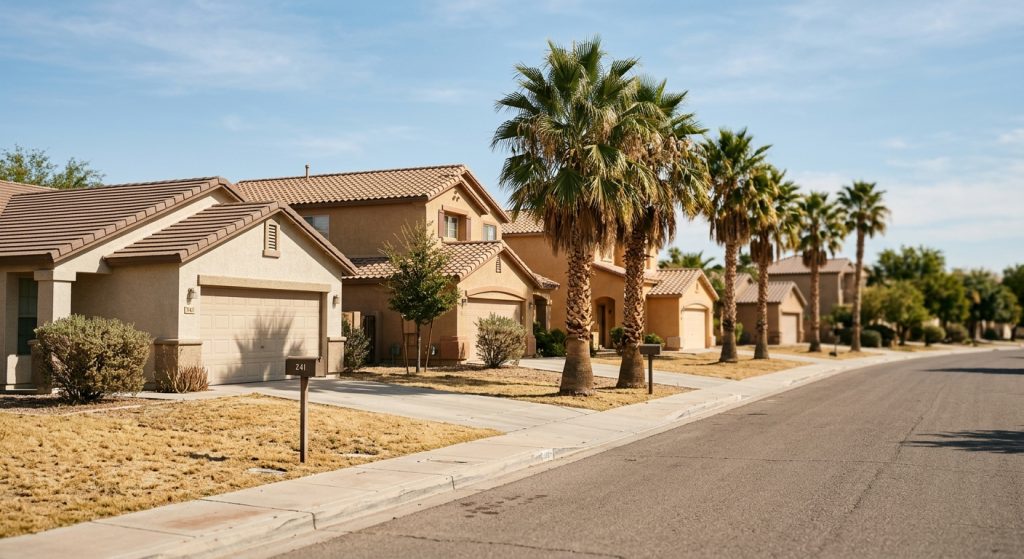
The number of people trying to buy a home in the United States fell to the lowest level in Redfin’s records in September, while the number of homes for sale climbed to the highest since March 2020 — leaving sellers outnumbering buyers by 62.6 percent, the widest gap the brokerage has measured since it began tracking the balance in 2013.
Redfin put the September buyer count at 928,892 and the seller count at 1,510,784 in an analysis published Oct. 14. Buyers fell 2.4 percent from August, a fifth consecutive monthly decline. Sellers rose 1.2 percent. It was the fourth straight month in which the gap set a record.
“This is a buyer’s market born out of caution, not strength,” said Asad Khan, a senior economist at Redfin, who attributed the imbalance to buyers being priced out or deterred by economic uncertainty rather than to any surge in supply-side confidence.
Forty-one of the 50 largest metros now favor buyers
Redfin classifies a metro as a buyer’s market when sellers outnumber buyers by more than 10 percent, a seller’s market when buyers lead by more than 10 percent, and balanced in between. By that measure 41 of the 50 most populous U.S. metro areas were buyer’s markets in September — the most in the company’s records.
The largest seller surpluses were in the Sun Belt. Miami led at 158.9 percent, with 7,304 buyers against 18,909 sellers. Nashville, Tenn., followed at 152.3 percent, on 7,161 buyers and 18,068 sellers. Houston was third at 134.6 percent, where 20,230 buyers faced 47,456 sellers, and Austin, Texas, was fourth at 130.9 percent. Tampa, Fla., widened sharply, to a 103.7 percent surplus from 82.2 percent a month earlier.
Only five metros still favored sellers: Nassau County, N.Y., where buyers outnumbered sellers by 28.6 percent, followed by Montgomery County, Pa., at 22.7 percent, Newark, N.J., at 18.5 percent, Milwaukee at 16.1 percent and San Francisco at 10.6 percent. Four metros were balanced — Boston, Chicago, New Brunswick, N.J., and Providence, R.I.
Two markets moved the other way. Detroit’s seller surplus narrowed to 37.9 percent from 46.5 percent, and St. Louis narrowed to 24.5 percent from 26.9 percent.
The price split between the two kinds of market
The pricing consequence is already visible in Redfin’s numbers. In the five metros where buyers still outnumber sellers, prices rose an average of 6.4 percent year over year in August. Across buyer’s markets, the average was about 1 percent. Redfin attributes the difference to continued competition where supply remains tight.
That is a sharper version of the divergence RealtyWire has tracked through the year, including Redfin’s finding that national prices rose 3.7 percent in August while four Texas metros fell. The pattern in September’s buyer-seller data is the same geography: the metros that built the most are the metros where sellers now wait longest.
Redfin says listings keep accumulating because homes that do not sell stay on the market while new listings are added on top of them, with Sun Belt homebuilding contributing additional supply. Some owners are listing now in the expectation that prices will fall further; others are moving for ordinary reasons. Many owners with substantial equity, the company notes, are choosing to wait.
How this compares with August, and what it rests on
The September gap of 62.6 percent follows the 56.9 percent gap Redfin now reports for August. When RealtyWire covered that month’s data, Redfin had put the August figure at 58 percent; the company says its seasonally adjusted figures are subject to revision.
The methodology matters for reading the headline number. Redfin counts sellers as the number of active MLS listings — a hard count. Buyers are an estimate, derived from the typical time between a buyer’s first home tour and closing, combined with MLS data on active listings and pending sales. The buyer figure is therefore a modeled number, not a census, and the gap is best read as a direction rather than a precise ratio.
The direction is unambiguous, and it is consistent with the demand data arriving from other sources. Pending sales fell in every major metro in Redfin’s most recent reading, with 14.5 percent of agreed deals collapsing before closing. Redfin ties the buyer-side weakness to the cost stack facing purchasers: mortgage rates that have risen for weeks, plus insurance and homeowners-association costs that have climbed fastest in Florida.
For agents, the practical read is that negotiating leverage in most of the country’s big markets now sits with the buyers who are still transacting — a smaller group than at any point Redfin has measured, and one with more room to ask for concessions or walk away.