
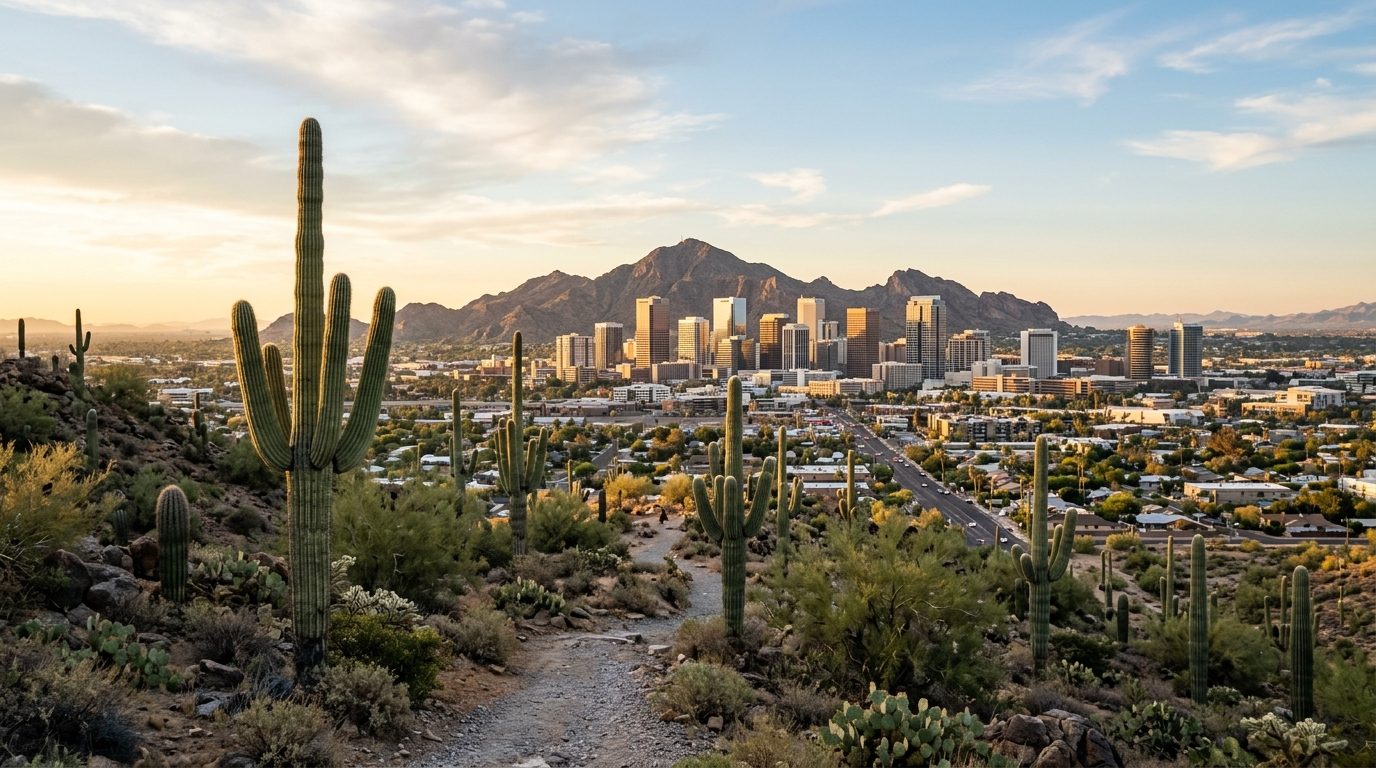
Current real estate market data, news and analysis for the Phoenix-Mesa-Chandler, AZ metropolitan area — 5.2M residents across Maricopa and Pinal counties.
Data as of May 2026. Sources: Redfin Data Center, U.S. Census Bureau.
Latest Phoenix Real Estate News
Phoenix Real Estate Market Overview
The Phoenix-Mesa-Chandler metropolitan area covers Maricopa and Pinal counties and had an estimated 5,228,938 residents on July 1, 2025. Its housing stock is shaped by decades of outward desert development: low-rise detached houses dominate much of Phoenix, Mesa, Glendale, Chandler and the suburban rings, while condominiums and apartments are concentrated around downtown Phoenix, Tempe, Old Town Scottsdale and selected light-rail corridors. Central Phoenix and nearby districts contain postwar ranch houses, block construction and infill redevelopment. Communities built farther from the Valley’s core more often combine newer detached homes, homeowners associations, neighborhood parks and master-planned amenities. Sun City and Sun City West add a substantial age-restricted housing segment that operates differently from the family-oriented subdivisions common in Gilbert, Chandler and the southeast Valley.
Within Greater Phoenix, price differences track location, lot size, age and access to employment centers. Paradise Valley, north Scottsdale, Arcadia, Biltmore and gated foothill communities generally occupy higher price tiers. Chandler, Gilbert and Tempe mix established neighborhoods with higher-cost areas near technology and university employment. Mesa spans older entry-level districts, golf communities and newer development toward the east. Buckeye, Goodyear, Surprise and the western edge of Phoenix contain large tracts of recent construction, while Queen Creek, Maricopa, Casa Grande and the newly incorporated Town of San Tan Valley extend the commuter housing market into Pinal County. Any lower purchase price available on Phoenix’s edge must be weighed against commuting distance, summer utility demand and the pace at which roads, schools and retail services are added.
Across Greater Phoenix, employment is distributed among health care, public administration, education, financial services, distribution, tourism and advanced manufacturing. Banner Health and the State of Arizona are major employment anchors, Arizona State University supports jobs and housing demand in Tempe, and Phoenix Sky Harbor functions as a transportation and employment center. Intel’s Chandler operations and TSMC’s fabrication complex in north Phoenix have increased the importance of semiconductor manufacturing and its supplier network. Warehouses and distribution facilities follow the interstate corridors and available industrial land in the West Valley, Mesa and Pinal County.
June 2026 data show a market with limited price acceleration rather than a return to the rapid gains recorded earlier in the decade. Redfin reported a metro median sale price of $463,612, up 0.9% from June 2025, with a median 64 days on market. Redfin also reported that active listings were 2.6% lower than a year earlier and new listings were down 4.9%, while closed sales increased 5.3%. Zillow’s separate June measure placed the typical Phoenix-area home value at $445,343, down 1.5% year over year, and its sales-count nowcast was up 8.9%. The difference between Redfin’s closed-sale median and Zillow’s modeled typical value reflects different methods rather than an error. Zillow’s Observed Rent Index placed typical rent at $1,733, unchanged from a year earlier.
New construction remains central to Phoenix’s housing pipeline because developable land is concentrated at the urban fringe, but water certification is a property-level and subdivision-level concern rather than a single metrowide answer. Arizona’s assured-water-supply rules evaluate whether subdivisions in active management areas can demonstrate a 100-year supply. The Arizona Department of Water Resources’ 2026 Phoenix Active Management Area model update continued to identify limits on groundwater-based determinations, while designated municipal systems and developments with established certificates may operate under different supply arrangements. Buyers comparing a new subdivision in Buckeye, Queen Creek or Pinal County should identify the water provider, certificate status, utility structure and planned transportation links rather than relying on a general claim that the entire Phoenix market has one water condition.
Cities and Towns in the Phoenix Metro Area
Notable Communities and Neighborhoods
Phoenix Real Estate Market FAQ
What is the median home price in the Phoenix metro?
Redfin reported a June 2026 median sale price of $463,612 for the Phoenix metro, up 0.9% from a year earlier. Zillow’s separate typical-home-value measure was $445,343, so the two figures should not be treated as interchangeable.
Is Phoenix a buyer’s or seller’s market right now?
The June 2026 indicators are consistent with a balanced-to-buyer-leaning market in many Phoenix segments rather than a broad seller’s market. Homes spent a median 64 days on market and sale prices rose only 0.9% year over year, although Redfin’s 2.6% annual decline in active listings means leverage varies by neighborhood and price tier.
Which parts of the Phoenix metro tend to have higher home prices?
Paradise Valley, north Scottsdale, Arcadia, Biltmore and selected foothill or gated communities generally occupy higher price tiers than the metro median. The West Valley, older sections of Mesa and Apache Junction, and portions of Pinal County often provide lower entry prices, but property age, lot size, commute and community fees can change the comparison.
What should buyers know about new construction and water supply in the Phoenix metro?
Outer-growth areas such as Buckeye, Queen Creek, Maricopa and San Tan Valley contain substantial new construction, but water arrangements differ by provider and subdivision. Buyers should verify the project’s assured-water-supply status because Arizona evaluates a 100-year supply for subdivisions in active management areas and current groundwater rules do not affect every municipal system or previously certified development in the same way.
Nearby Markets