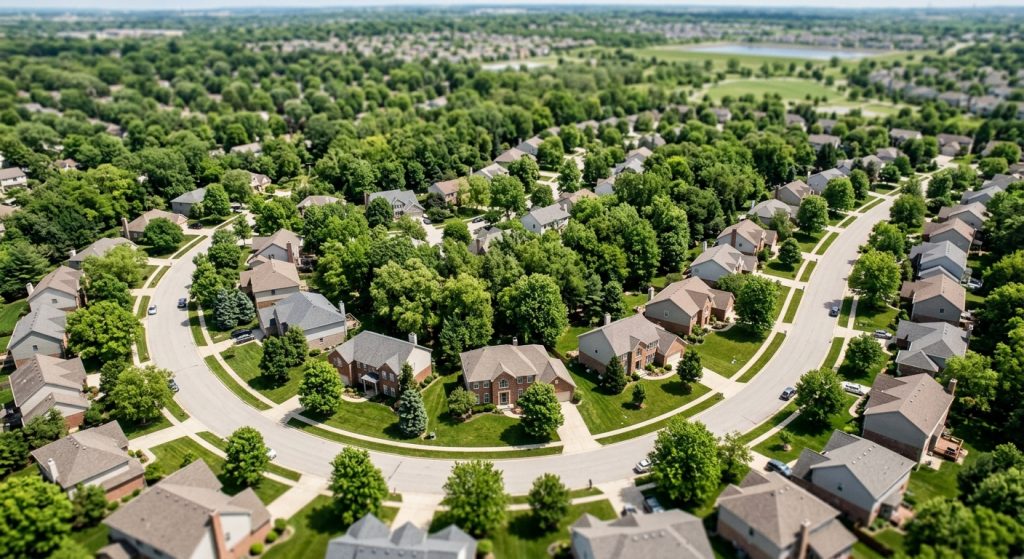
The market value of everything American households own in real estate reached $49.8 trillion in the second quarter of 2026, according to the Federal Reserve’s Z.1 Financial Accounts, released Sept. 11. Owners’ equity in that stock — what is left after mortgages — stood at $35.8 trillion.
The quarter’s gain was 2.3%. The gain over the full year was 2.5%, which means the April-to-June quarter accounted for nearly all of the annual increase and that household real estate values were roughly flat across the three quarters before it, by RealtyWire’s arithmetic on the two figures.
The debt side grew faster. Real estate secured liabilities — mortgages, home equity loans and home equity lines of credit — rose 1.1% in the quarter to $14.0 trillion, and were 3.0% higher than a year earlier. Assets grew 2.5% over the same span. Debt outrunning asset values is what gradually compresses the equity share, though from a starting point that remains historically high.
That share was 71.9% in the second quarter, the 13th consecutive quarter above 70%, National Association of Home Builders economist Jesse Wade wrote in the trade group’s analysis of the release, published Sept. 14.
Why the aggregate rises when price indexes cool
The $49.8 trillion figure is not a price index. It is the estimated market value of the whole residential stock households hold, so it moves with the number of homes as well as with what each is worth. Wade made the point directly: “This approach explains why household real estate wealth can continue to rise even as other measures may show a slowing in home price growth.”
That gap has been visible all year. Repeat-sales measures have shown modest single-digit appreciation and sharp regional splits — national prices gained 1.5% in June while the Chicago-to-Seattle spread widened to nine points — even as the aggregate value of the stock kept climbing.
Reading the equity number against the other equity numbers
Several organizations publish home equity totals and they do not measure the same population. The Z.1 covers all households, including owners who carry no mortgage at all, which is why its equity figure runs far above the tallies built from mortgage servicing data. Cotality’s first-quarter report put net equity among mortgaged homeowners at a record $17.9 trillion, with roughly $34 trillion across all properties — close to the Fed’s $35.8 trillion once scope is matched, and a useful check that the two series are telling the same story.
The practical consequence of a large equity cushion is that it gets borrowed against. Homeowners sitting on low fixed mortgage rates have increasingly chosen second liens over refinancing, and HELOC balances rose $13 billion nationwide in the second quarter according to Federal Reserve Bank of New York data. The $14.0 trillion liability figure in the Z.1 includes that borrowing.
Who holds the housing wealth
The Fed’s distributional data lags the headline series by a quarter. Through the first quarter of 2026, households in the bottom 50% by net worth held $4.8 trillion of real estate value, or $71,429 per household. The 50th-to-90th percentile band held the largest pool, $22.7 trillion, at $418,893 per household.
Above that, the concentration steepens. Households between the 90th and 99th percentiles held $14.8 trillion, about $1.2 million each. The 99th to 99.9th percentiles held $4.5 trillion, about $3.8 million each. The top 0.1% — households whose net worth starts at $46,369,052 — held $1.9 trillion, averaging $14.2 million of real estate apiece.
The middle band’s dominance is the figure worth sitting with. More than $22 trillion of American real estate wealth is held by households in the upper-middle of the net-worth distribution rather than at the very top — which suggests, on our reading, that the market’s overall health stays tied to ordinary move-up and downsizing activity rather than to the luxury tier. The bottom half’s $71,429 average, meanwhile, is an average that includes households owning no real estate at all.
For context on the upper end of the price distribution, the National Association of Realtors reported this year that 8% of U.S. homes are now worth $1 million or more. More national housing data coverage is in RealtyWire’s Housing Market section.
The Federal Reserve’s next Z.1 release, covering the third quarter, is scheduled for Dec. 10.