U.S. construction spending fell for a second straight month in July, slipping 0.5% to a seasonally adjusted annual rate of $2.16 trillion, as home building continued to retreat and office construction — the category that absorbs most data center work — climbed to its highest level in years.
The U.S. Census Bureau released the July figures Tuesday morning, in report number CB26-140. Total construction put in place was estimated at $2,157.6 billion, down from a revised June estimate of $2,167.7 billion and 3.8% below the July 2025 level of $2,242.6 billion. The monthly change carries a margin of error of plus or minus 0.8 percentage points, meaning the July decline is not statistically distinguishable from zero; the year-over-year drop, at plus or minus 1.5 points, is.
Through the first seven months of 2026, construction spending totaled $1,244.6 billion, 3.5% below the $1,289.7 billion recorded over the same stretch of 2025.
Single-family building leads the decline
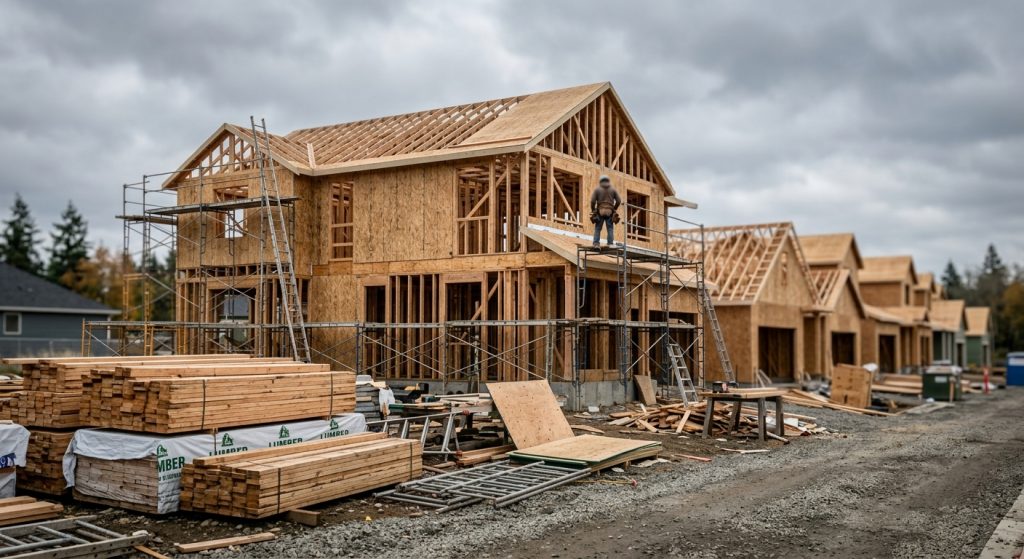
Residential construction did the most damage. Total residential spending ran at an $871.2 billion annual rate in July, down 1.3% from June and 7.3% below July 2025 — the steepest year-over-year decline of any major category tracked in the report.
Within private residential work, new single-family construction fell to a $395.2 billion annual rate, a 3.2% drop in a single month and 6.5% below a year earlier. That is a sharp break from a spring in which the category held between roughly $407 billion and $412 billion from March through June. New multifamily construction was comparatively steady at $115.1 billion, up 0.2% from June and down 0.9% year over year.
The pullback is consistent with the pipeline data. Census figures released last month showed single-family housing starts dropping sharply in July even as permits ticked higher, and June’s spending report had already recorded residential construction cooling while nonresidential work held up.
Office and power spending keep nonresidential afloat
Private nonresidential construction moved the other way, rising 0.4% to a $755.2 billion annual rate. That increase does clear the report’s confidence interval of plus or minus 0.3 percentage points, making it one of the few statistically significant monthly moves in the release.
The office category, which is where the Census Bureau counts data center construction, was the standout: private office spending reached a $123.3 billion annual rate in July, up 3.3% from June and 21.3% above July 2025. No other major private nonresidential category is growing at anything close to that rate. Private power construction, which includes the generation and transmission capacity those facilities require, rose 0.5% to $161.5 billion and is up 6.5% year over year.
The strength is narrow. Private commercial construction — retail, warehouse and related space — slipped 0.2% to $116.2 billion and is down 4.7% from a year ago. Private health care construction fell 0.4% to $56.3 billion, down 5.3% year over year.
The largest drag remains manufacturing. Private manufacturing construction ran at a $167.8 billion annual rate in July, down 0.8% from June and 21.7% below July 2025, as the wave of chip and battery plant construction that peaked in 2024 and 2025 continues to unwind.
Public spending flat, highways still ahead of last year
Public construction spending was estimated at a $543.4 billion annual rate, down 0.2% from a revised $544.7 billion in June but 1.7% above July 2025. Educational construction, the largest public category, was at $112.3 billion, down 0.2% for the month. Highway construction came in at $150.3 billion, also down 0.2% from June but 4.5% higher than a year earlier. Neither monthly change is statistically significant.
What it means
The verified picture from the release is a two-track construction economy: residential spending falling on both a monthly and annual basis, and a small group of nonresidential categories tied to computing and electricity carrying nonresidential totals in the other direction. Total nonresidential spending was essentially flat for the month, up 0.1% to $1,286.4 billion, and remains 1.3% below last July.
The Census Bureau itself cautions that month-to-month changes in these seasonally adjusted figures are often irregular, and that it can take two months to establish a trend for total construction and as long as eight months for individual categories. Most of the monthly moves in this report, including the headline decline, fall inside their margins of error.
RealtyWire analysis: the year-over-year comparisons are where the signal sits, and they point in two directions at once. A 7.3% annual decline in residential spending alongside a 21.3% annual gain in private office construction describes an industry reallocating labor and capital rather than one simply contracting — a shift RealtyWire has tracked in construction job openings data, where unfilled positions have climbed even as home building slows. Whether that reallocation continues depends on categories the July report shows are already decelerating.
The Census Bureau will publish August construction spending on Oct. 1.