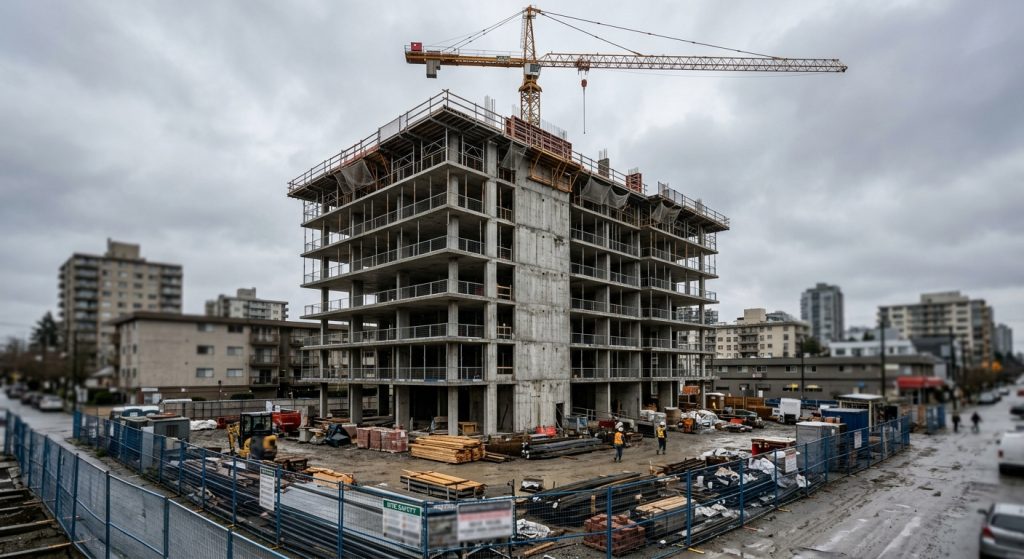
It took an average of 18.9 months to get an apartment building from building permit to finished units in 2025, about three weeks faster than the year before but still far slower than the industry managed a decade ago, according to an analysis of federal construction data published Monday by the National Association of Home Builders.
The improvement matters because time is money in multifamily development: every extra month between permit and certificate of occupancy is another month of construction-loan interest, another month before a building generates rent, and another month of exposure to whatever the market does next.
What the 2025 numbers show
NAHB economist Na Zhao based the analysis on the U.S. Census Bureau’s Survey of Construction, the federal survey that tracks starts, completions and characteristics of new residential buildings and is partly funded by the Department of Housing and Urban Development.
Average permit-to-completion time for multifamily buildings fell to 18.9 months in 2025 from 19.6 months in 2024, a reduction of 0.7 months. The construction phase alone — from groundbreaking to completion — averaged 16.5 months, leaving roughly 2.4 months between a permit being issued and a shovel going in the ground.
Set against the longer record, 2025 still looks slow. The 18.9-month average is 3.5 months longer than the 15.4 months recorded in 2009 and almost seven months longer than the series low of 12 months in 2013. Nearly all of that deterioration sits in the build itself: start-to-completion time has stretched from 13.4 months in 2009 to 16.5 months last year.
NAHB attributes the persistently long schedules in part to continuing shortages of skilled construction labor.
Bigger buildings, longer schedules
Building size is the clearest dividing line in the data. In 2025, properties with 20 or more units averaged 21.7 months from permit to completion, and buildings with five to nine units averaged 21.5 months. Buildings with 10 to 19 units came in at 18.5 months, while the smallest category — two-to-four-unit properties — finished in 14.9 months.
That matters more than it used to, because the mix has shifted decisively toward the slow end. The share of multifamily completions in buildings of 50 or more units rose from 43% in 2009 to 57% in 2025, a concentration RealtyWire covered when the completions data was released. A pipeline made up increasingly of large buildings is a pipeline that takes longer to deliver, even when individual project schedules hold steady.
Regional spread of more than five months
Geography adds another five-month spread. Apartments in the Northeast took the longest to build in 2025 at 21.9 months, followed by the West at 20.6 months. The South averaged 17.5 months and the Midwest was fastest at 16.6 months.
The ordering tracks what developers have long described in the two faster regions: comparatively lighter permitting and review processes, more greenfield sites, and a construction mix weighted toward wood-frame garden and mid-rise product rather than the concrete and steel high-rises more common in dense coastal markets.
What it means
The verified facts: multifamily construction timelines shortened modestly in 2025, by 0.7 months, and remain several months longer than any year between 2009 and 2015. The size and regional gaps in the 2025 data are large and consistent with prior years.
Attributed interpretation: NAHB links the elevated timelines to skilled-labor shortages that have not resolved.
RealtyWire analysis: a 0.7-month improvement is real but small, and it arrives alongside a shrinking pipeline. Fewer projects competing for the same subcontractors is the most straightforward explanation for schedules easing, which would make the 2025 gain a byproduct of slower development rather than evidence that the industry has solved its capacity problem. If that reading is right, the improvement would reverse whenever multifamily starts recover.
The timing question also runs into a demand question. Lease-up has been slow: just 41% of new apartments were leased within three months of completion in the most recent federal absorption data, the lowest rate since 2023. Faster delivery into a market that is taking longer to fill units is a mixed blessing for owners carrying construction debt.
What to watch
The next read on multifamily supply comes with the Census Bureau’s New Residential Construction report for August, scheduled for Sept. 17, which covers permits, starts and completions rather than build times. The Survey of Construction timing figures are annual, so the 2026 update will not arrive until next year — long enough for the current slowdown in starts to work its way through and test whether shorter schedules stick. More commercial real estate coverage is here.