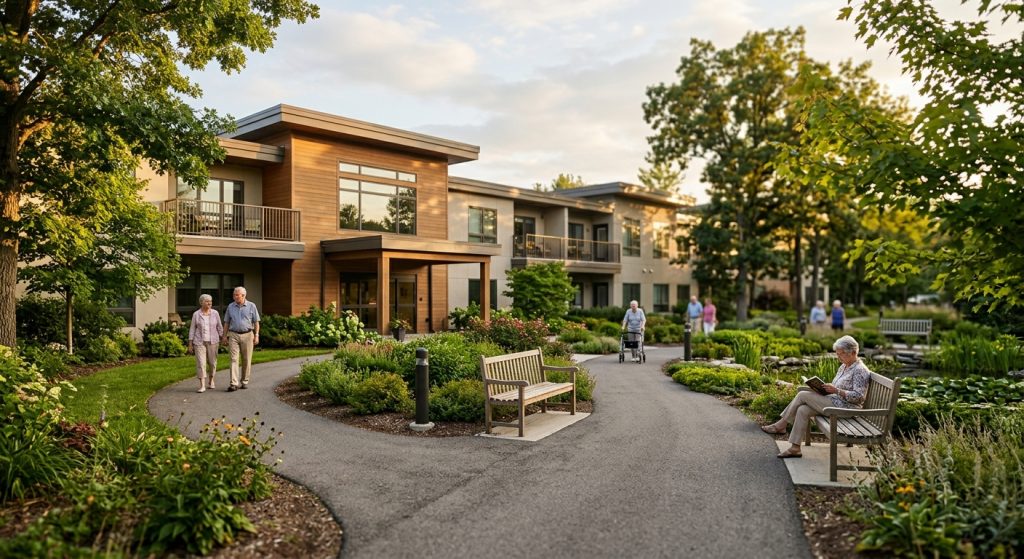
The senior housing industry will need more than $1 trillion in new investment through 2050 just to keep pace with America’s aging population, according to an updated market outlook released Wednesday by NIC MAP, the senior housing data provider.
The reason is a widening mismatch: the population most likely to move into senior housing is entering the steepest growth stretch in U.S. history at the same moment construction has fallen to near-record lows. Senior housing construction starts have declined roughly 67% since 2021, from more than 30,000 units to about 10,000 in 2025, NIC MAP said.
The Raleigh, N.C.-based firm published the second edition of its Senior Housing Market Outlook on Wednesday, revisiting projections it first made two years ago. Its conclusion is that the gap it flagged then has not closed but grown.
The demographic wave has arrived
The first baby boomers turned 80 in 2026. NIC MAP projects the U.S. population age 80 and older will grow by approximately one-third by 2030 and nearly double by 2040 — adding roughly 5 million people within five years and 13 million within 15.
That demand is no longer theoretical. Senior housing stabilized occupancy has climbed above 90% industry-wide, and over the past four years an average of about 32,000 additional units have been occupied annually, roughly 50% more than the previous record, according to the report.
“The demographic wave is no longer something on the horizon. It is here, and we’re struggling to grow fast enough to meet the needs of our aging population,” said Arick Morton, chief executive of NIC MAP. “Two years ago, the data pointed to a growing imbalance between senior housing supply and demand. Today, that imbalance is even greater.”
Morton added that the distinction matters for capital allocation: “Demographics on paper are increasingly becoming move-ins on the ground. For operators, owners and capital providers, that is an important distinction. The question is no longer simply whether demand will arrive, but what the industry is doing to ensure that it will have sufficient capacity to serve it.”
Why construction stalled
NIC MAP attributes the development slowdown to the same forces weighing on commercial real estate generally — elevated interest rates, higher construction costs and labor constraints — compounded by senior housing operating margins that are still recovering from pandemic-era disruption.
Timing makes the shortfall harder to reverse. Senior housing communities typically take about two years to go from construction start to opening, so a thin pipeline today constrains how quickly supply can respond to demand that is already showing up.
The arithmetic compounds. To hold occupancy near 90%, NIC MAP estimates the industry would need a cumulative 576,000 additional units by 2030 and more than 1 million by 2035. Annual need rises above 140,000 units in 2027 and stays near 100,000 units a year through much of the following decade — against a current construction pace of roughly 10,000 units.
Where the $1 trillion goes
Converted to dollars at what NIC MAP calls credible per-unit costs, the cumulative capital required to maintain today’s level of senior housing availability exceeds $1 trillion through 2050.
Not all of it would go into ground-up development. More than two in five existing senior housing units are now more than 25 years old, which NIC MAP says makes renovation, repositioning, campus expansion and adaptive reuse a meaningful share of future capacity.
Investors have already been rotating toward the sector. Senior housing was the top-performing property type in the NCREIF Property Index in 2025, generating a 10.6% one-year total return against 4.9% for the broader index, with transaction volume topping $15 billion, according to the report. That performance has shown up in public-company results: Welltower posted its 15th consecutive quarter of double-digit senior housing net operating income growth, and Ventas raised its 2026 senior housing investment target by 50% to $4.5 billion.
What it means
The verified facts are the demographic projections, the occupancy and absorption figures, and the construction data — the 80+ population is growing, communities are filling, and starts are down about two-thirds from 2021.
The $1 trillion figure is NIC MAP’s own estimate, built on its assumptions about per-unit costs and about holding occupancy near 90%. It is a forecast of what maintaining the status quo would cost, not a measure of committed capital. NIC MAP also sells data and analytics to the investors and operators the report addresses, so its framing of the gap as “one of the largest long-term investment opportunities in commercial real estate” is an interested one.
RealtyWire’s read: the near-term constraint is financing cost, not demand. A pipeline that takes two years to deliver and has already thinned for four straight years means the 2027–2030 supply picture is largely fixed regardless of what capital does next — which points toward acquisition and renovation of existing communities, where more than 40% of the stock is at least 25 years old, as the faster path to capacity. That is consistent with the pace of large portfolio trades in the sector over the past year.
What to watch: whether construction starts turn up in late 2026 and 2027 data, whether occupancy keeps climbing past 90%, and whether the capital chasing the sector flows into new development or continues concentrating in existing assets. More sector coverage is in RealtyWire’s Commercial Real Estate section.