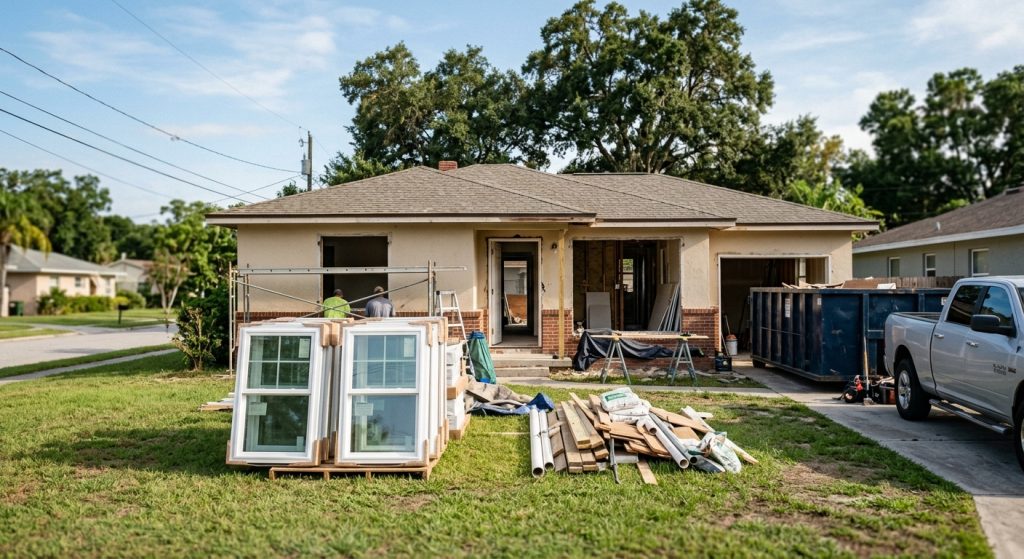
The typical U.S. home flip returned a gross profit of $60,526 in the second quarter, and the typical margin on those deals narrowed to 21.5% — the continuation of a squeeze that has run for two years and has left flippers in several large Texas markets with almost no gross margin at all.
The figures come from ATTOM’s Q2 2026 U.S. Home Flipping Report, released Oct. 1, 2026. The property-data firm counted 77,991 single-family homes and condominiums flipped in the quarter, or 6.2% of all home sales nationwide.
Both the volume and the returns moved the wrong way for investors. The 21.5% typical gross margin was down from 25.7% in the first quarter and 27.6% in the second quarter of 2025. Typical gross profit — the difference between the purchase price and the resale price — fell from $66,932 in the first quarter and $71,000 a year earlier.
“Flippers are still making money in most markets, but the typical return continues to narrow,” said Rob Barber, ATTOM’s chief executive. “The second-quarter numbers continue the general downward trend in profit margins and gross profits we have seen over the past two years.”
Flipping is a shrinking share of a shrinking market
At 6.2% of all sales, the flipping rate was down from 8% in the first quarter and 7.3% a year earlier. The raw count of flips rose from the first quarter’s 64,760 but came in below the 80,477 recorded in the second quarter of 2025.
The retreat was close to universal across the country. The flipping rate fell quarter over quarter in 87.1% of the 186 metropolitan areas ATTOM had enough data to analyze — 162 of them — and was down year over year in 131 metros, or 70.4%.
Where flipping remains concentrated says something about where the arithmetic still works. The highest flipping rates were in Columbus, Ga. (13.6% of all home sales), Canton, Ohio (11.6%), Akron, Ohio (11.2%), Fayetteville, N.C. (10.9%) and Macon, Ga. (10.6%) — all comparatively low-priced markets.
Among metros with more than a million residents, Cleveland led at 10.4%, followed by Columbus, Ohio and Memphis, Tenn., at 9.5% each, Dallas at 9.4% and Phoenix at 8.9%. The lowest rates in that group were Rochester, N.Y. (2.7%), Seattle and Washington, D.C. (4% each), Pittsburgh (4.5%) and Portland, Ore. (4.8%).
In Texas’s big metros, the gross margin has nearly vanished
The spread between the best and worst large markets is extraordinary. Pittsburgh posted the largest typical margin among metros above a million people, at 81.5%, followed by Buffalo, N.Y. (76.6%), New Orleans (75%), Virginia Beach, Va. (63.4%) and Philadelphia (62.8%).
At the other end, the typical flipped home in San Antonio sold for 0.3% less than the investor paid for it. The next-lowest margins among large metros were Dallas (1.8%), Austin, Texas (2.8%), Houston (3.7%) and Salt Lake City (4.7%). Four of the five large metros with the thinnest margins are in Texas.
Margins fell quarter over quarter in 126 of the 186 metros studied, or 67.7%.
The price band that works, and the one that doesn’t
Purchase price mattered more than geography in determining whether a flip paid. Homes acquired for $100,000 to $200,000 produced the best typical margins nationally, at 28%, with $200,000 to $300,000 close behind at 26% and $300,000 to $400,000 at 20%.
Below that, the math breaks. Homes bought for $50,000 or less generated a typical loss of $15,000 — a negative 38% return. On our reading, that reflects the kind of property available at that price: the discount at purchase is rarely large enough to absorb what the rehabilitation turns out to cost.
Flips also moved faster. The typical flipped home took 161 days from purchase to resale, down from 165 days in the first quarter and 166 days a year earlier.
The share of flipped homes sold to buyers using Federal Housing Administration-backed mortgages rose to 10.7% from 10.1% in the first quarter, though it remains below the 12.3% of a year ago. That share was highest in Baton Rouge, La. (28.2%), Reading, Pa. (25.3%), Tuscaloosa, Ala. (23.9%), Scranton, Pa. (23.4%) and El Paso, Texas (22.3%).
Two caveats that matter
The headline margin is a gross figure. ATTOM’s methodology note is explicit that gross flipping profit excludes rehabilitation costs and other expenses, which the firm says flipping veterans estimate typically run between 20% and 33% of a property’s after-repair value. A 21.5% gross return is therefore not a 21.5% take-home return, and for a large share of these deals the net number will be far smaller.
ATTOM also flags a data caveat of its own: it expanded its property record coverage during 2026, so transaction-count metrics “may reflect both market activity and broader data coverage compared to prior periods.” The margin and profit figures are not affected by that, but the flip counts should be read with it in mind.
The quarter’s conditions have not improved since. Resale values are the variable flippers cannot control, and financing costs for the buyers they sell to have risen sharply — the 30-year mortgage average jumped to 7.28% on Oct. 1, its highest in nearly three years. The same squeeze has been visible in homeowners’ balance sheets, with the share of equity-rich mortgaged homes falling to a near five-year low in ATTOM’s second-quarter equity report.
More housing market coverage is collected on RealtyWire’s housing market page.