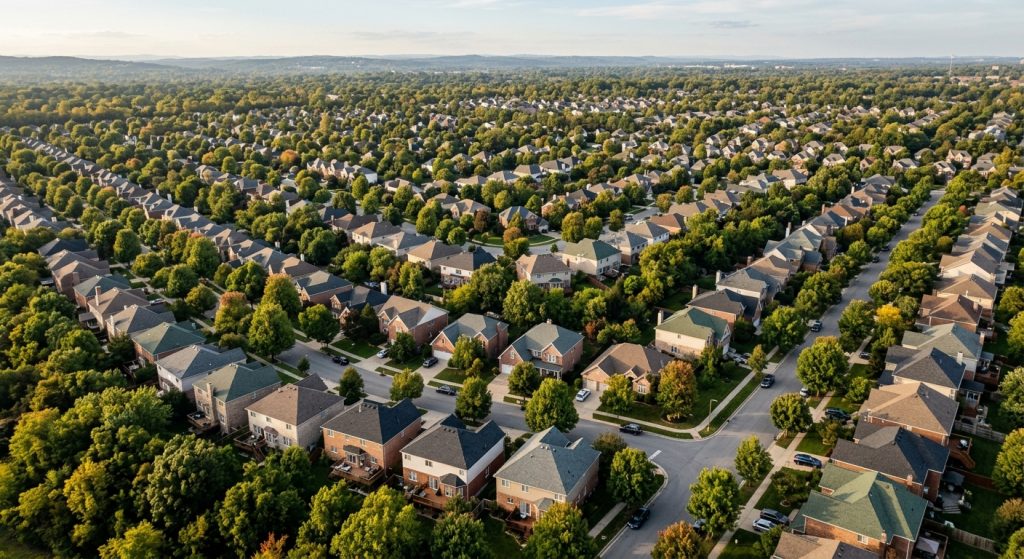
U.S. home prices rose 1.9% in the year through July, an acceleration from June’s 1.6% but still barely half the pace of consumer inflation — leaving housing wealth worth less in real terms for a 14th consecutive month.
The reading comes from the S&P Cotality Case-Shiller indices released Sept. 29. The 10-City Composite rose 3.4% over the year, up from 3.0% in June, and the 20-City Composite rose 2.5%, up from 2.2%. On a seasonally adjusted basis, the national index gained 0.3% from June to July; the 10-City gained 0.4% and the 20-City 0.3%.
Before seasonal adjustment, the monthly picture was flatter still: the national index edged up 0.12%, the 10-City 0.03%, and the 20-City slipped 0.01%. Rebecca Kaufman, associate director of commodities at S&P Dow Jones Indices, called that “a notable departure from typical seasonal patterns,” since the unadjusted indices normally outrun their adjusted counterparts in midsummer.
The real-terms gap narrowed but did not close
Consumer prices rose 3.4% over the same 12 months, down slightly from 3.5% in June. That leaves nominal home price growth roughly 1.5 percentage points short of inflation.
“While home prices continued to decline in real terms in July 2026, marking the 14th consecutive month of real declines, slightly lower inflation and stronger nominal home price appreciation helped narrow the gap,” Kaufman said.
In level terms the indices remain far above their pandemic-era highs. The national index stood at 337.31 in July, about 9.3% above its June 2022 peak and 15% above the January 2023 trough. The 10-City Composite, at 373.86, is 13% above its own peak.
A nine-point spread from Chicago to Seattle
The metro-level divergence that has defined this cycle held. Chicago led all measured markets for a fifth consecutive month at 6.9%, followed by New York at 5.8% and Cleveland at 4.2%. Seattle posted the largest annual decline for a second straight month at -1.6%, with Las Vegas at -1.3% and Denver at -1.1%.
Six of the 19 metros reported for July were negative year over year: Seattle, Las Vegas, Denver, Tampa (-0.7%), Portland (-0.7%) and Dallas (-0.4%). Phoenix (+0.05%), Atlanta (+0.3%) and Charlotte (+0.3%) were effectively flat. Miami and San Francisco, both up about 3.5%, stood out among Sun Belt and West Coast markets.
No July figure was published for Detroit. S&P attributed the gap to transaction recording delays at the Wayne County recording office; the June figure remains available.
Kaufman framed the pattern geographically rather than by climate or migration: “The years-long East-West divide persists, with six out of the eight Eastern metropolitan markets recording greater year-over-year changes in July versus June, compared with just two of the eight Western metropolitan markets.” That is the same split RealtyWire described when the Chicago-to-Seattle gap reached nine percentage points in June, and the top-to-bottom spread was about 8.4 points in July.
FHFA’s separate index tells a similar story
The Federal Housing Finance Agency published its own July reading the same morning. The agency’s seasonally adjusted purchase-only House Price Index rose 0.3% from June and 2.6% from July 2025. The previously reported flat reading for June was left unrevised.
FHFA’s index draws only on mortgages bought or guaranteed by Fannie Mae and Freddie Mac, so it excludes cash purchases and loans above the conforming loan limit — a narrower slice of the market than Case-Shiller measures. Across the nine census divisions, monthly changes ran from -0.8% in the Mountain division to +1.5% in the Middle Atlantic; over 12 months the range was +0.6% in the Mountain division to +6.3% in the Middle Atlantic. That is the same East-versus-interior-West pattern, drawn on a coarser map.
Where the inflation actually came from
Kaufman made one point that complicates the simple “prices are losing to inflation” reading. Much of July’s 3.4% increase was concentrated outside the categories that bear on housing: energy prices rose 14.7% and gasoline 24.6% over the year, while core inflation, which strips out food and energy, rose just 2.5%.
“This distinction is important because persistent inflation in shelter and other core categories tends to have a more direct impact on housing affordability than energy-driven price fluctuations,” she said.
On our reading, measured against core inflation rather than the headline number, the national index’s 1.9% gain is a shortfall of about six-tenths of a point rather than a point and a half — and the FHFA reading of 2.6% is roughly level with it.
Both indices carry a two-month lag, so July’s data predate the run-up in mortgage rates now working through the market. FHFA’s next monthly report, covering August, is scheduled for Oct. 27. More housing market coverage is collected on our housing market page.