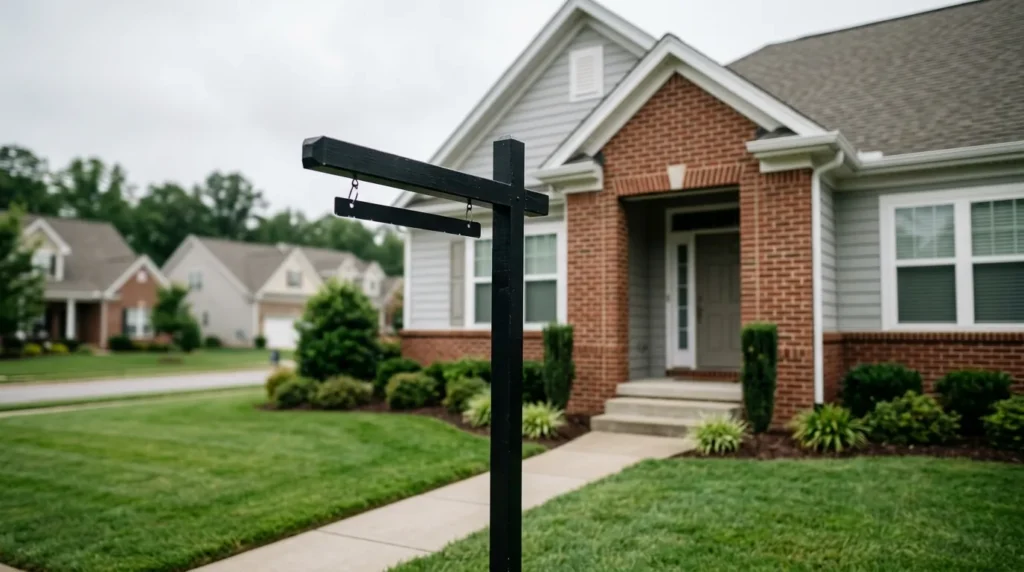
About 5.8% of U.S. home listings were withdrawn from the market in April, tying December 2025 for the highest delisting rate since March 2020, according to Redfin. Atlanta’s reported rate reached 10.7%.
Sellers are increasingly choosing to pull a listing rather than accept a weaker offer — a decision that quietly distorts the inventory figures the market relies on.
Key facts
- National delisting rate: about 5.8% of listings in April.
- Historical context: ties December 2025 for the highest rate since March 2020.
- Atlanta: reported delisting rate of 10.7%, roughly one in nine listings.
- Delisted homes may return to the market when conditions improve.
Delisting creates inventory that does not show up in the data
Active-listing counts are the market’s most-watched supply measure, and delistings undercut their reliability.
When an owner withdraws rather than reduces price, the home disappears from active inventory — but the underlying desire to sell does not disappear with it. That creates a reservoir of shadow supply: homes whose owners still intend to move, waiting for better conditions. Reported inventory therefore understates true supply, and the gap widens exactly when delisting accelerates.
The practical consequence is that inventory gains look milder than the market’s real state of oversupply. An analyst reading only active listings in a market like Atlanta, where roughly one listing in nine was withdrawn, would meaningfully underestimate how many owners want out.
Rate lock-in gives sellers the option to wait
Delisting at this scale is possible because most owners are not forced sellers.
A homeowner carrying a mortgage well below current rates has a powerful reason to stay put: moving means giving up that rate and financing the next purchase at roughly 6.3%. That lock-in converts selling from a necessity into a choice, and when the market fails to deliver an acceptable price, the rational response is to withdraw and keep the low-rate loan.
It is a meaningfully different dynamic from 2008, when distress forced transactions regardless of price. Today’s seller can simply decline, which is why price declines have been shallow even as demand softened — supply leaves the market instead of clearing at lower prices.
What returning inventory could mean
Withdrawn listings are deferred, not cancelled. If mortgage rates fall or local conditions improve, a meaningful share of these homes should return.
That creates a plausible ceiling on any future rally. A drop in rates that brings buyers back would also bring back sellers who withdrew — potentially adding supply at the same moment demand improves and muting the price response many owners expect from lower rates.
For sellers weighing the decision now, the arithmetic favors realism over withdrawal. Carrying costs continue during a wait, and with prices forecast to rise only modestly in 2026, the gain from waiting a year may not cover taxes, insurance and maintenance in the interim.
What it means
For sellers, delisting should be a considered strategy, not a reaction to disappointment. If a home has drawn no offers, that is pricing or presentation information — and our guide to why listings go stale covers the diagnosis. Relisting later restarts days-on-market but does not fix an unresolved problem.
For buyers, a high delisting rate is a signal worth using. Owners who recently withdrew are motivated but unwilling to reduce publicly, and an off-market approach can occasionally reach terms a listed negotiation would not.
For agents, tracking local delisting rates provides a genuine edge in pricing conversations. In a market where one in nine listings is withdrawn, the visible competition is only part of the supply a seller is actually competing against.
—