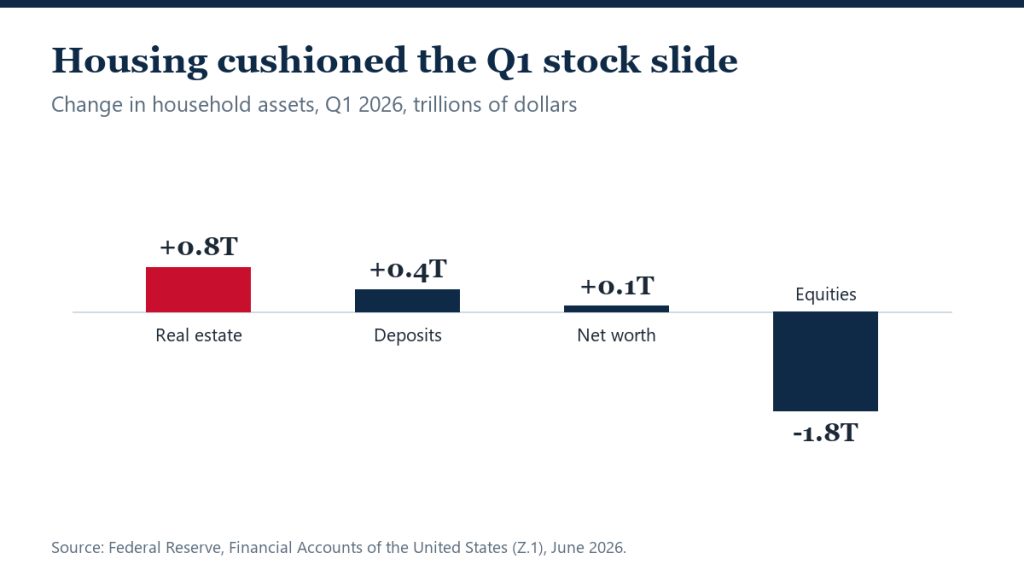
American households lost $1.8 trillion of stock-market wealth in the first quarter — and barely felt it in the aggregate, because their homes quietly gained $0.8 trillion. Add $0.4 trillion of deposit growth and total household net worth still inched up $0.1 trillion, the Federal Reserve’s Financial Accounts data shows.
It is the clearest quarter in years for housing’s old-fashioned role: the stabilizer in the national balance sheet. Equity portfolios repriced violently; the housing stock — slow, unlisted, lived-in — appreciated through the turbulence.
The quarter in balance-sheet terms
- Corporate equities: down $1.8 trillion (directly and indirectly held).
- Owner-occupied real estate: up $0.8 trillion.
- Deposits: up $0.4 trillion, including money-market funds.
- Household net worth: up $0.1 trillion on net.
The cushion is not evenly stuffed
The Fed itself flags the distributional catch: equities are concentrated among higher-income households, while housing wealth is the middle class’s dominant asset. In a quarter like Q1, that concentration works in the middle’s favor — the households most exposed to the stock slide had the deepest cushions elsewhere, and the median homeowner’s balance sheet barely noticed Wall Street’s quarter.
The stabilizer has a slow leak, though: with home prices growing about 1–2% nominally while inflation runs near 4%, real housing wealth is eroding even as the dollar figure grows. Housing cushioned the quarter; it is not compounding the way it did in 2020–2022.
What it means
For owners, the data is a case for viewing the home as ballast rather than a growth engine — and for keeping the asset protected and maintained accordingly, per RealtyWire’s ownership-cost guides. For prospective buyers, it is the counterpoint to rent-versus-buy math that considers only price appreciation: ownership’s portfolio role showed up precisely when the alternative asset class fell 6% in a quarter.
The debt side of the ledger reinforces the stability story. Household borrowing grew just 2.6% at an annual rate in the quarter — the slowest of any major sector, against 5.7% for the economy as a whole and 6.7% for the federal government. American households entered the market wobble with the most conservative balance-sheet growth in the system, a sharp contrast with the leverage build-ups that preceded past housing stress.
The Fed’s distributional data sharpens the picture further: equity ownership concentrates in the top decile, while the middle three wealth quintiles hold most of their net worth in their homes. A quarter where houses gained and stocks fell is, mechanically, a quarter where wealth inequality narrowed at the margin — a rare occurrence this decade.
For homeowners, the practical translation is that home equity — now near record aggregate levels — remains the household sector’s shock absorber. Owners tapping it should treat it accordingly: maintenance and prudent borrowing preserve the cushion that Q1 demonstrated the value of.
FAQ
Does rising real-estate value mean my home gained too?
Not necessarily — the $0.8 trillion is a national aggregate. Regional data shows the Northeast and Midwest gaining while several Western markets declined.
Why did net worth rise if stocks fell so much?
Households hold more than stocks: real estate and deposit gains offset most of the equity decline, leaving net worth up $0.1 trillion.
Is housing a better investment than stocks?
They do different jobs. Stocks historically return more with more volatility; housing provides shelter, leverage and stability. Q1 showcased the stability half of that trade.