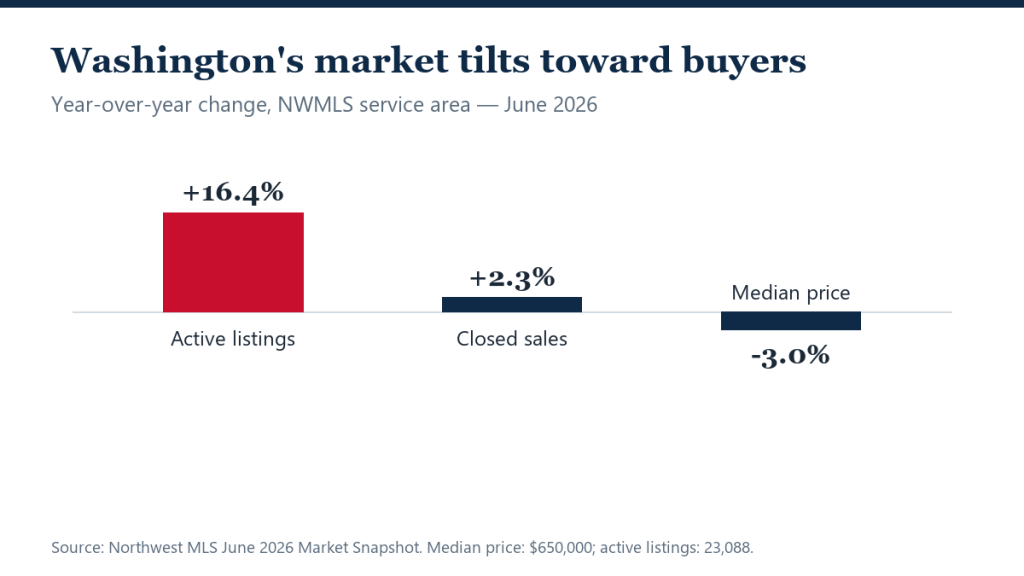
Washington homebuyers have their widest selection of the year. Active listings across the Northwest MLS service area climbed 16.4% from a year earlier — and 8.0% in a single month — to 23,088 homes in June, while the median sale price slipped 3.0% year over year to $650,000, the Northwest MLS reported.
Demand did not disappear into the extra supply: closed sales rose 2.3% from June 2025 and 10.2% from May. But with inventory growing roughly seven times faster than sales, the balance of power keeps drifting toward buyers — the statewide version of the national pattern in rising inventory that does not automatically crash prices.
June in the NWMLS data
- Active listings: 23,088 — up 16.4% year over year and 8.0% from May.
- Closed sales: 6,847 — up 2.3% year over year and 10.2% from May.
- Median sale price: $650,000, flat for a second straight month and down 3.0% from June 2025.
- Showings: 25,583 listings received at least one showing, up 8.7% from a year ago.
The rate whiplash behind the numbers
Steven Bourassa, director of the Washington Center for Real Estate Research, traced the year’s stop-start demand directly to financing costs. “At the end of February 2026, 30-year fixed mortgage interest rates had reached their lowest point since September 2022: 5.98%,” he said. “Then the war with Iran started, resulting in increased inflation and, in turn, higher interest rates. By the end of June, rates had risen by just over half a percentage point to 6.49%.”
That half-point round trip is the difference between a monthly payment buyers accept and one they postpone — the same sensitivity NAR flagged in June’s national sales decline.
A quiet affordability lever
One underused detail in the report: 73.6% of listings across the NWMLS service area qualified for down payment assistance programs. In a market where the median home runs $650,000, assistance eligibility on nearly three-quarters of inventory is a meaningful lever for first-time buyers — the kind of program-stacking covered in RealtyWire’s first-time buyer checklist.
What it means
For Washington sellers, June’s data recommends pricing realism: buyers have 1,700 more homes to choose from than a month ago, and the median price is already 3% below last year. For buyers, expanding selection plus softening prices — with rates the wild card — makes this the most workable Washington market since 2022.
The forward indicators lean cooler. Pending sales declined modestly from both May and a year earlier — pointing to softer July closings — and keybox activity and scheduled showings eased from May’s pace in a typical seasonal rhythm. Still, 25,583 listings drew at least one showing in June, up 8.7% from a year ago: buyers are looking in force, just deciding slowly.
As with every statewide number, the median hides wide local variation across the NWMLS service area — from Seattle-area price points more than double the statewide median to Eastern Washington markets well below it. The 16.4% inventory gain is the shared reality; how much leverage it buys depends on the county.
FAQ
Are Washington home prices falling everywhere?
The service-area median fell 3.0% year over year, but conditions vary by county and price tier; the median held at exactly $650,000 for a second month, suggesting stabilization rather than freefall.
Is 16% more inventory a buyer’s market?
It is movement toward one. Inventory is growing far faster than sales, giving buyers choice and negotiating room, but demand remains active enough that well-priced homes still sell.
What would change the trajectory?
Mortgage rates. February’s 5.98% briefly ignited demand; June’s 6.49% cooled it. A sustained move back below 6% would tighten this market quickly.