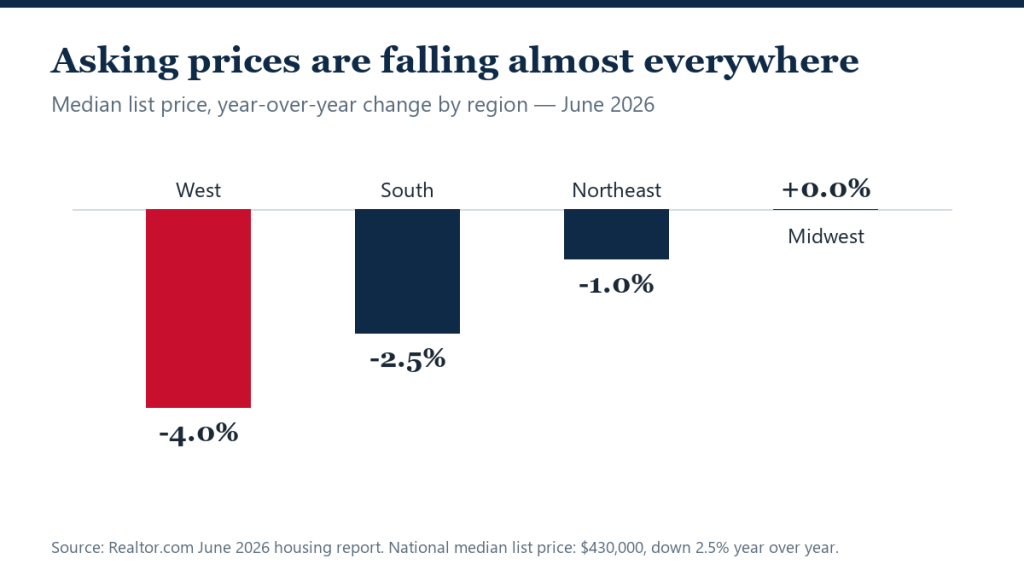
The national median asking price fell 2.5% year over year in June to $430,000 — the steepest annual decline Realtor.com has recorded — as sellers increasingly price to the market from day one rather than listing high and cutting later.
The repricing appears to be working. Active listings rose 1.9% from a year earlier to 1,102,615, buyers responded with more contract activity, and Realtor.com’s economists described the shift as a return to a functioning market rather than a slump. Price per square foot, which controls for the mix of homes listed, fell a more modest 2.1%.
June by the numbers
- Median list price: $430,000 — flat from May, down 2.5% year over year.
- Active listings: 1,102,615, up 4.1% from May and 1.9% from a year ago.
- New listings: 463,480, down 2.4% from May but up 2.4% year over year.
- Price reductions: 18.8% of listings — up seasonally from May’s 17.5%, but down 1.9 points from a year ago.
- Days on market: 53, unchanged from a year earlier.
“Sellers are reading market conditions and are pricing accordingly from the start rather than listing high and cutting later, and buyers are taking note and making bids,” said Danielle Hale, chief economist at Realtor.com. “This is a welcome sign that we are in a functioning market.”
Two housing markets, four years in the making
The national decline hides a stark regional split. List prices fell 4.0% year over year in the West and 2.5% in the South, while the Northeast slipped just 1.0% and the Midwest held flat. Adjusted for home size, prices are still rising in the Midwest (+1.5%) and Northeast (+0.9%).
Measured from the June 2022 peak — when the national median listing price hit $449,000 — the divergence is sharper still: the West is down 7.3% and the South 3.5%, while the Midwest is up 10% and the Northeast up 12.6%. “The two Americas story in housing is now four years in the making,” said Jake Krimmel, senior economist at Realtor.com. Among the 50 largest metros, prices sit below their 2022 peak in 28 and above it in 22.
That map matters for strategy. In the West and South, the data rewards sellers who cut early or offer concessions — the approach detailed in RealtyWire’s look at record seller concessions. In the Midwest and Northeast, tight supply still gives sellers the upper hand.
What it means if you’re pricing a home now
The lesson from June is that overpricing has a measurable cost: buyers are active but selective, and homes priced to current comparables are drawing bids while aspirational listings sit. For sellers, that argues for pricing to the local market from the start — and for buyers, the record share of repriced inventory means the first list price is increasingly a starting point, not a verdict.
Two details undercut any doom reading of the record decline. Days on market held at 53 — exactly flat with last June — meaning realistically priced homes are selling on a normal clock. And the 18.8% price-reduction share, while up seasonally from May, is 1.9 points below last June’s 20.7%: fewer sellers are being forced into cuts precisely because more of them priced correctly on day one.
FAQ
Are asking prices the same as sale prices?
No. Asking (list) prices measure what sellers hope to get; sale prices measure what buyers actually pay. Sale prices hit a record in June even as asking prices fell — a sign sellers are adjusting expectations toward what the market will bear.
Why are prices falling in the West and South but rising in the Midwest and Northeast?
Supply. Sun Belt metros built aggressively and inventory has recovered, forcing competition among sellers. Northeastern and Midwestern markets remain supply-constrained, so even modest demand keeps prices climbing.
Does a record annual decline mean a crash?
No. The decline is 2.5% against a backdrop of record sale prices and stable days on market — a repricing within a functioning market, not distress. Realtor.com’s data shows price cuts are actually less common than a year ago.