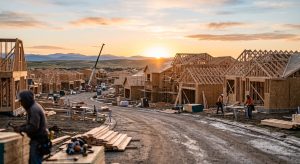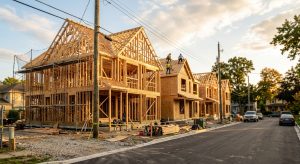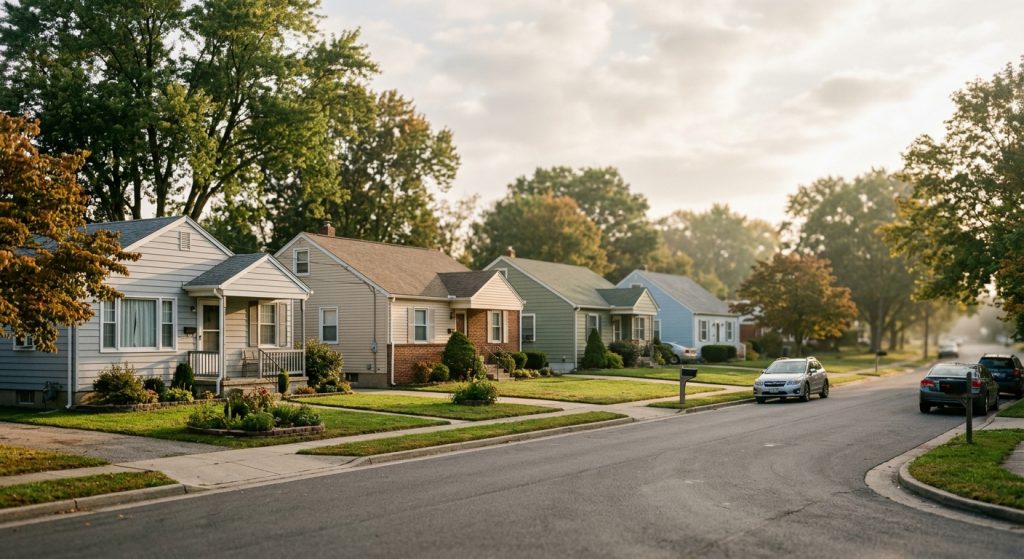
The U.S. homeownership rate held at 65.0% in the second quarter of 2026, unchanged from a year earlier and not statistically different from the first quarter’s 65.3%, as tight affordability continued to lock younger buyers out of the market, according to the Census Bureau’s Housing Vacancy Survey, released July 28, 2026.
The homeowner vacancy rate ticked up slightly to 1.2%, while the rental vacancy rate held steady at 7.3%. Realtor.com senior economist Hannah Jones said the data reflects a market stuck in place: “The rate continues to plateau in a narrow low- to mid-65% band, with affordability pressures and limited supply showing little sign of easing their grip on the market.”
The stagnation was most pronounced among younger households. Homeownership among adults under age 35 fell to 35.2%, down 1.6 percentage points from the first quarter and 1.2 points from a year earlier — even as ownership rates for every other age group held essentially flat, underscoring the specific difficulty younger, typically first-time, buyers face securing entry-level homes amid a housing market where new-home prices have continued falling without translating into broader affordability relief.
Homeownership also diverged by race and ethnicity. The rate for non-Hispanic white households edged up to 74.5%. Black homeownership improved to 45.4%, while Hispanic homeownership held steady at 48.1%. The rate for Asian, Native Hawaiian and Pacific Islander households declined to 58.6%, and the rate for all other racial groups combined stood at 54.4%.
Rental markets showed sharper regional variation than ownership. The South posted the highest vacancy rates in the country — 9.5% for rentals and 1.5% for homeowner housing — while the Midwest followed at 6.9% rental vacancy. The Northeast (5.9%) and West (5.3%) posted the lowest rental vacancy rates, and the Northeast was the only region where rental vacancy rose year over year. Vacancy also varied by geography type: principal cities saw 8% rental vacancy, compared with 6.9% in suburbs and 5.8% in nonmetro areas.
Nationally, rental vacancy rates remain within the range most housing economists consider healthy — enough turnover to accommodate movers without signaling oversupply or acute shortage. That has kept renting a viable, flexible alternative for households priced out of ownership, a dynamic tracked in RealtyWire’s broader look at 2026 rental market trends, where cooling rent growth has been offsetting some of the pressure on the ownership side.
What it means: The Census Bureau’s quarterly survey is the government’s authoritative, verified measure of homeownership and vacancy, making the 65.0% figure a hard data point rather than an estimate. That the rate is statistically unchanged both year over year and quarter over quarter is itself the headline: the market isn’t deteriorating sharply, but it also isn’t recovering. Jones’s characterization of a “plateau” tied to affordability and supply is attributed economist interpretation, consistent with the widening age gap in the underlying data, though the report itself does not draw a causal conclusion.
What to watch: Whether the under-35 homeownership rate continues to slide in the third-quarter release, and whether the South’s markedly higher vacancy rates — a regional outlier in both rental and homeowner housing — begin narrowing as new supply in Sun Belt markets is absorbed.