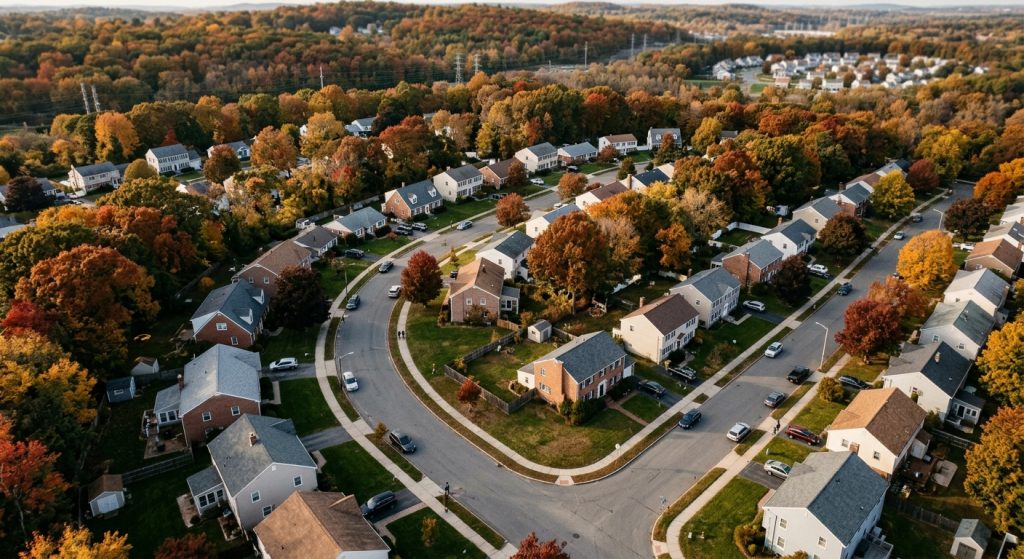
Existing-home prices rose from a year earlier in 78% of U.S. metro areas in the third quarter of 2026. That is fewer than in the spring, and the share of markets with falling prices grew to 21%. The figures come from the National Association of Realtors’ quarterly metro price report, released Oct. 29. The national median single-family existing-home price rose 1.7% year over year to $432,900, the same annual growth rate as the revised second-quarter figure.
The quarter-over-quarter shift is modest. Gains narrowed from 80% of metros in the second quarter, when NAR reported its Q2 results, and the share of markets with double-digit increases slipped to 4% from 5%. The report covers roughly 235 metropolitan statistical areas.
Regions: Northeast and Midwest lead, West slips
The regional split continues the pattern of the past year. The Northeast and Midwest lead, while the West has turned negative:
- Northeast: $561,500, up 4.0%
- Midwest: $342,500, up 3.6%
- South: $374,900, up 1.0%
- West: $629,000, down 0.6%
NAR notes that its regional medians come from a separate sample that includes rural areas, so they do not necessarily track the metro figures.
Among large markets, the 10 biggest annual gains were concentrated in the Gulf South, the industrial Midwest and the Northeast. Gulfport-Biloxi-Pascagoula, Miss., led at 11.0%. It was followed by Rochester, N.Y. (10.9%), Jackson, Miss. (10.1%), Beaumont-Port Arthur, Texas (9.9%) and York-Hanover, Pa. (9.2%). The rest of the list was Grand Rapids-Wyoming, Mich. (8.7%), Cleveland-Elyria, Ohio (8.6%), Fort Wayne, Ind. (8.5%), Youngstown-Warren-Boardman, Ohio-Pa. (7.6%) and Hartford-West Hartford-East Hartford, Conn. (7.5%).
The Bay Area is still the most expensive
California holds eight of the 10 most expensive metro areas. San Jose-Sunnyvale-Santa Clara tops the list at a $1,920,000 median, up just 0.3%. It is followed by Anaheim-Santa Ana-Irvine at $1,470,000 (up 5.0%) and San Francisco-Oakland-Hayward at $1,350,900 (up 2.7%). Urban Honolulu ($1,199,700, up 6.4%) and Bridgeport-Stamford-Norwalk, Conn. ($874,200, up 3.5%) are the only entries outside California. The steepest decline in the top 10 was in Salinas-Monterey, Calif., where the median fell 7.0% to $948,900.
NAR chief economist Lawrence Yun tied the Bay Area’s prices to technology money. “The artificial intelligence technology boom continues to push Bay Area home prices higher, keeping the region the most expensive in the country,” he said in the release. He also pointed to the Midwest as a source of value: “Many markets in the Midwest offer exceptional value with more affordable homes, making homeownership more attainable.”
Florida turns back up
Yun singled out Florida, where prices had been sliding in many markets. “Throughout the last year, home prices declined in many Florida markets. This quarter, however, homes in nearly all Florida markets are showing price gains,” he said. He added that “price declines in other markets may also be brief if the local job market and economy are solid.” That is his forecast, not a finding of the report.
Yun’s broader read was that prices are holding up even as activity stalls. “Even with affordability challenges causing the housing market to stagnate, home prices continue to set record highs in most parts of the country,” he said. He estimated that the average house has appreciated by $146,000 over the past seven years.
Affordability edged worse from spring
Affordability got slightly worse from spring, though it was a bit better than a year ago. NAR puts the monthly mortgage payment on a typical existing single-family home, with 20% down, at $2,251. That is up $48 from the second quarter and $69 from a year earlier. Families spent an average of 24.1% of income on mortgage payments, up from 23.9% last quarter but down from 24.5% a year ago.
For first-time buyers, the payment on a typical $368,000 starter home with 10% down was $2,208. That took 36.3% of income, up from 36.0% in the second quarter and down from 37.0% a year earlier.
A different picture in more recent data
NAR’s report is a quarterly view of closed sales through September. Weekly data point to a softer fall. Redfin reported Oct. 29 that its median U.S. home-sale price for the four weeks ending Oct. 25 was $389,601, down 0.1% year over year. It was the second straight weekly reading below the prior year and, according to Redfin, the first declines in more than three years. Redfin also put the median monthly mortgage payment at $2,786 at a 7.32% average rate, and said pending sales fell to the lowest level in its records, which date to 2021.
The two measures differ in timing and method. NAR reports quarterly single-family medians by metro, while Redfin’s weekly figures are four-week rolling medians across more than 900 metros. Together with this week’s Case-Shiller reading for August, the data on our reading point to annual appreciation that is flattening nationally. Rising-price markets still outnumber falling ones nearly four to one, but the falling group is growing. NAR’s next quarterly metro release is scheduled for Feb. 3, 2027, according to the association’s metro data page. More coverage is in RealtyWire’s housing market section.