Building material costs rose a median of 6.7% over the past year for the typical U.S. home builder, but that industry-wide figure conceals a split that is reshaping who can afford to build. Builders who started five or fewer homes in 2025 reported a median increase of 9.1%. Builders who started 100 or more reported 1.8%.
The findings come from special questions added to the July 2026 NAHB/Wells Fargo Housing Market Index survey and published Aug. 24 by NAHB economist Paul Emrath in the association’s Eye on Housing analysis.
A five-fold difference in input cost inflation between the smallest and largest builders is not a rounding error. On a house where materials run a third of the cost, it is the difference between absorbing a manageable increase and pricing yourself out of your own market.
What builders reported
The distribution shows most builders clustered in the moderate range. The largest single group, 28.4%, reported increases between 5% and 9.99%. Another 22.4% reported increases under 5%, and 22.1% reported increases of 10% to 14.99%. Taken together, 72.9% of builders reported material cost increases of up to 15% over the year.
That leaves better than a quarter of builders reporting increases above 15% — the tail that does the real damage to a small operation’s margins.
The median for the industry as a whole, 6.7%, runs well ahead of general consumer inflation. But the industry median describes almost nobody: it sits between a small-builder experience near 9% and a large-builder experience under 2%.
Why size buys price protection
NAHB offers three explanations for the gap, framed by Emrath as reasonable rather than proven. Larger builders may have greater ability to stockpile materials ahead of announced price increases. They can sign long-term supplier contracts that lock in current pricing. And they carry supplier relationships substantial enough to negotiate deferred increases when prices move.
Each of those advantages runs on volume and balance sheet. A builder starting three houses a year has no warehouse, no forward contract worth a supplier’s attention, and no leverage to ask for a delay. They buy at the counter price on the day they need the material.
The mechanism matters because it is structural rather than cyclical. When input prices are flat, the advantage is worth little. When they are moving, it compounds every quarter.
Stacked on everything else
Materials are one of several cost pressures NAHB has been tracking. The association notes that regulatory costs rose 40% between 2021 and 2026, and builders continue to report construction labor shortages alongside mortgage rates that have kept buyer demand soft.
Those pressures land on the same small firms. RealtyWire has reported that residential construction wage growth has been cooling, which relieves one line of the cost stack — but wage relief that arrives because demand is weak is not the kind of relief a builder wants.
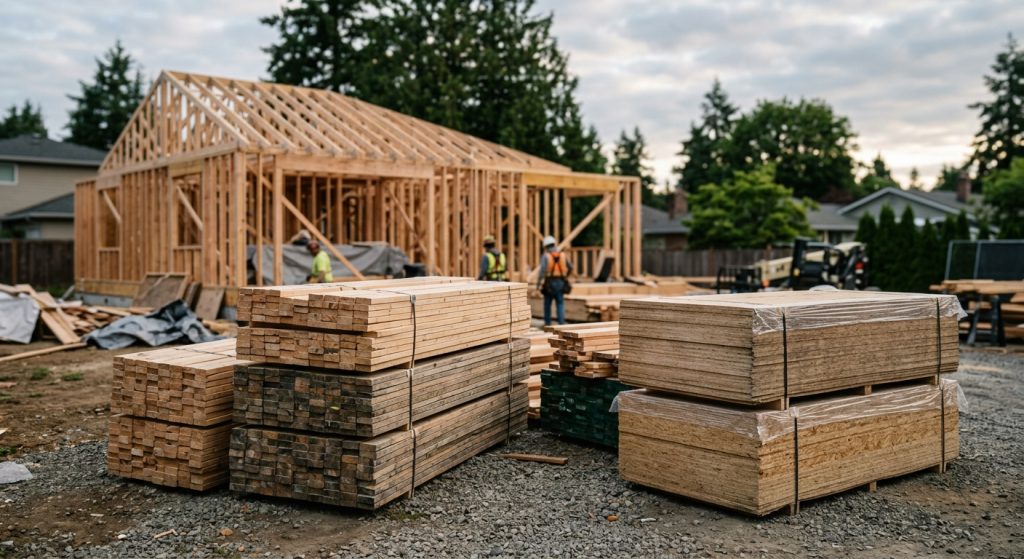
On the materials side specifically, trade policy remains a live variable. RealtyWire covered the U.S. lumber industry’s support for tariffs on Canadian softwood, a duty that raises the delivered cost of framing lumber and that small builders have the least ability to hedge against.
What it means
Verified: the survey findings above, as reported by NAHB from its own July 2026 HMI panel.
Attributed: the explanation for the size gap is NAHB’s, offered as plausible reasoning rather than a tested finding. The survey also reflects what builders say they experienced, not audited invoice data.
RealtyWire analysis: this is a consolidation signal more than an inflation signal. Cost inflation that falls disproportionately on small firms operates like a tax on staying independent, and it arrives in a year when NAHB has separately reported that builder acquisition approaches have roughly doubled. A small builder facing 9% input inflation, 40% higher regulatory costs than five years ago and soft demand has a shrinking set of options, and selling is one of them.
There is a supply consequence in that. Small and mid-size builders are disproportionately the ones who build infill lots, scattered sites and small subdivisions that large production builders will not touch. If the cost structure keeps squeezing them out, the housing that disappears is not evenly distributed across markets.
What to watch: whether the size gap narrows in the next round of HMI special questions, how framing lumber prices move through the fall, and whether builder M&A activity keeps climbing at the pace NAHB reported earlier this month.