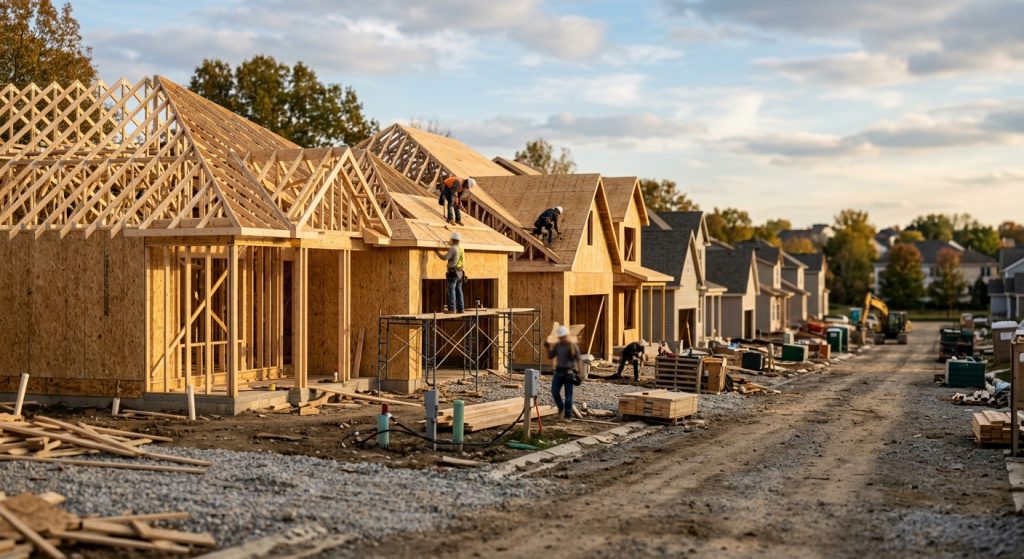
U.S. builders broke ground on homes at a seasonally adjusted annual rate of 1,309,000 in October, up 9.9% from September, but the pipeline behind those starts shrank sharply: building permits fell 7.4% to 1,295,000, the lowest permit rate since May 2020, according to the monthly new residential construction report released Nov. 18, 2026, by the U.S. Census Bureau and the Department of Housing and Urban Development.
The split matters because permits are the leading edge of the housing starts data. A jump in starts tells you what crews began pouring in October; a drop in permits tells you how much less work builders are lining up for the months ahead.
October housing starts: the headline numbers
Total starts rose from a revised September rate of 1,191,000 and were 2.8% above the October 2025 rate of 1,273,000. The Census Bureau cautions that neither change is statistically significant: the 90% confidence interval on the monthly gain runs plus or minus 16.8 percentage points, and on the annual comparison plus or minus 16.5 points. The agency also notes that it can take six months to establish an underlying trend in starts.
Single-family starts, the measure most closely tied to the for-sale market, rose 4.0% to an annual rate of 864,000 from a revised 831,000 in September. That is still about 3% below the 893,000 pace of October 2025.
Most of the monthly gain came from larger apartment buildings. Starts in buildings with five or more units jumped to an annual rate of 433,000 from 345,000 in September, an increase of roughly 25%, and were about 22% above a year earlier.
Permits slide, led by single-family
The permit numbers, which the Census Bureau says are not subject to sampling error the way the starts estimates are, were weaker across the board. Total authorizations of 1,295,000 were 7.4% below September’s revised 1,398,000 and 8.7% below the October 2025 rate of 1,418,000. In the Census series as compiled by the St. Louis Fed’s FRED database, the last month with a lower permit rate was May 2020, when authorizations fell to 1,251,000 during the pandemic shutdowns.
Single-family permits fell 8.7% in a month to 772,000, the lowest since January 2023 in the same FRED series, and nearly 13% below the 886,000 pace a year earlier. Permits for buildings with five or more units slipped to 475,000 from 501,000.
The South, the country’s largest building region, drove the decline. Permits there fell to an annual rate of 675,000 from 756,000, a drop of about 11%, with single-family authorizations down to 466,000 from 504,000. Single-family permits in the West fell to 148,000 from 173,000. Total permits in the Midwest were flat at 213,000, and the Northeast fell to 135,000 from 145,000.
Units authorized but not yet started fell 3.5% to 276,000, another sign that the backlog of approved projects waiting for crews is thinning rather than building.
Regional starts swing widely
Starts moved sharply by region, though the regional estimates carry even wider error margins than the national figure:
- Midwest: 239,000, up from 161,000 in September.
- South: 747,000, up from 676,000.
- West: 228,000, down from 234,000.
- Northeast: 95,000, down from 120,000.
On a year-to-date basis, which smooths out the monthly noise, the picture is a slow year rather than a turnaround. Through October, an estimated 1,142,700 homes were started on an unadjusted basis, 1.1% fewer than in the same period of 2025. Single-family starts were down 4.6% year to date, while starts in buildings with five or more units were up 8.3%. Year-to-date permits were down 1.9%, with single-family authorizations off 4.2%.
Completions and the construction pipeline
Completions rose 6.5% in October to an annual rate of 1,272,000 but were 10.4% below the October 2025 pace of 1,419,000. Year to date, completions are down 12.3%, the steepest decline of any of the report’s three main measures. Single-family completions rose to 900,000, and completions in buildings with five or more units were 362,000.
An estimated 1,272,000 units were under construction at the end of October, essentially unchanged from September and about 3% fewer than a year earlier. Of those, 581,000 were single-family homes and 674,000 were in buildings with five or more units.
Reading the report
On our reading, October’s report points in two directions. The starts rebound, concentrated in apartments, suggests some multifamily projects that stalled earlier in the year finally got under way. The permit data argue that builders are pulling back on future single-family work, which is consistent with sentiment readings: the National Association of Home Builders’ index fell to 25 in November, its lowest since April 2012, with 46% of builders reporting price cuts.
For agents and buyers, fewer single-family permits now generally means fewer new homes competing with resale listings in 2027, though the effect depends heavily on local markets. The report’s error bands are a reminder not to over-read one month; earlier this year, single-family starts plunged in July before recovering. More data coverage is in our housing market section.
The Census Bureau will publish November figures on Dec. 17, 2026. It also announced that with the January 2027 report, due Feb. 18, 2027, the Survey of Construction will complete a scheduled sample redesign, and estimates for homes built in areas that do not issue permits, less than 1% of the totals, will be discontinued.