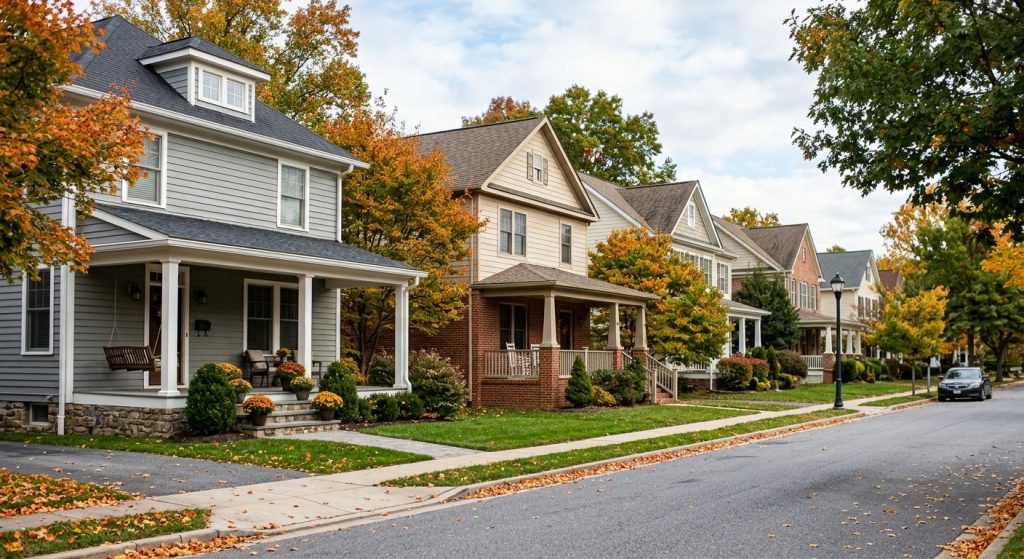
Homeowners added more to their home equity line of credit balances this summer than in any quarter since 2005, while the flow of mortgage balances into serious delinquency kept edging higher. HELOC balances rose $23 billion in the third quarter to $481 billion, according to the Federal Reserve Bank of New York’s Quarterly Report on Household Debt and Credit, released Nov. 10.
Total household debt grew $334 billion, or 1.8%, to $19.1 trillion at the end of September. That is $520 billion more than a year earlier and, the report notes, $5 trillion above the level at the end of 2019.
Mortgage balances: a big quarter, with an asterisk
Mortgage balances on consumer credit reports climbed $257 billion to $13.4 trillion, the bulk of the quarter’s overall increase. The headline number overstates new borrowing, however. The full report says “about half of the increase was due to a re-reporting of balances after a reporting gap in the previous quarter.”
Underlying activity did pick up. Newly originated mortgage debt, which counts both purchase loans and refinances as they appear on credit reports, totaled $595 billion in the quarter, which the bank described as notably higher. The credit quality of those new loans slipped: the 25th- and 10th-percentile credit scores of newly originated mortgages fell by six and three points, respectively.
“Household debt levels rose moderately, led by increases in mortgage and home equity line of credit originations,” Donghoon Lee, economic research advisor at the New York Fed, said in the release. “Although delinquency transition rates for housing debts have crept up, the overall credit quality of these loans remains strong.”
HELOCs keep climbing
The HELOC increase was the 18th consecutive quarterly gain, and it was larger than the $13 billion rise the bank reported for the second quarter, when homeowners were already tapping equity rather than give up low first-mortgage rates. HELOC credit limits rose $31 billion, or 2.9%, extending an expansion the New York Fed dates to 2022. Over the past year, HELOC balances are up $59 billion.
The New York Fed does not say why borrowers are leaning on HELOCs. On our reading, the pattern is consistent with the lock-in effect: with mortgage rates far above where many owners locked in, a second lien lets an owner with a low-rate first mortgage borrow against equity without refinancing the whole loan.
Delinquencies: housing debt moves the wrong way
Across all household debt, 5.0% of balances were in some stage of delinquency at the end of September, up 0.3 percentage points from the second quarter. The bank said transitions into early delinquency rose for mortgages and auto loans and improved slightly for credit cards.
For mortgages, the annualized share of balances newly becoming 90 or more days late rose to 1.60% from 1.28% a year earlier. The bank said that measure “worsened but remains modest by historical standards.” HELOC transitions into serious delinquency were flat from the prior quarter, the bank said, and at 1.17% sat below the 1.27% of a year earlier.
An analysis by the National Association of Home Builders of the same data put the share of mortgage balances already 90 or more days delinquent at 1.1%, up 0.1 percentage point, and noted that mortgage transitions into serious delinquency rose from 1.5% in the second quarter, a measure NAHB’s Catherine Koh wrote “has been gradually trending upward in recent years.”
About 62,000 people had a new foreclosure added to their credit reports in the quarter, an increase from the second quarter, the report says. Roughly 135,000 consumers had a new bankruptcy notation, slightly fewer than the prior quarter.
The New York Fed’s numbers line up with loan-level data from other trackers. ICE reported in its September first look that the national mortgage delinquency rate rose to 3.66% and active foreclosures reached their highest level since 2019.
Outside housing
Non-housing balances rose $55 billion, or 1.1%. Credit card balances grew $22 billion to $1.29 trillion, auto loans $21 billion to $1.73 trillion and student loans $5 billion to $1.66 trillion. Auto originations stayed high at $208 billion, and aggregate card limits rose $115 billion.
Credit cards were the bright spot on performance: transitions into serious delinquency eased to 6.87% from 7.05% a year earlier. Student loans remain the weakest category, with 10.9% of balances 90 or more days past due, up from 10.6% in the second quarter. The bank also published a Liberty Street Economics post on how credit card delinquencies have risen differently across neighborhood income levels.
The report is built from the New York Fed’s Consumer Credit Panel, a nationally representative, anonymized sample of Equifax credit data. More on borrowing costs and lending is in our mortgage coverage.