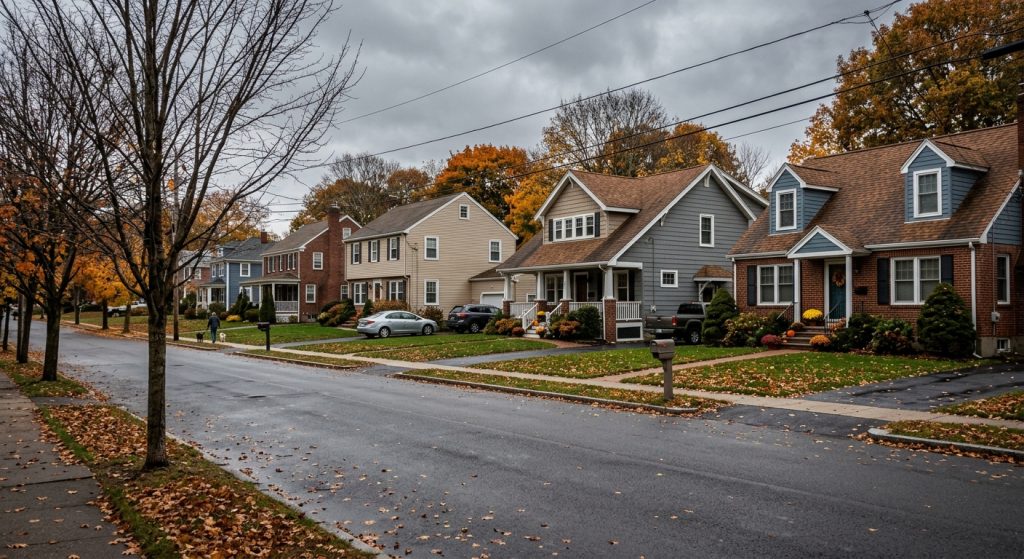
The median U.S. home-sale price slipped 0.1% from a year earlier to $389,601 in the four weeks ending Oct. 25, according to a Redfin housing market update published Oct. 29, 2026. That made two straight weekly readings below the year-ago level, following a 0.2% decline the week before. Redfin said these are the first year-over-year declines in more than three years.
The price dip comes as buying activity hits new lows. Pending home sales fell 1.8% from the prior week to 276,352 on a seasonally adjusted basis. That was 15.9% below a year earlier and the lowest level in Redfin’s weekly records, which go back to 2021. For the third week in a row, pending sales declined in every one of the 50 most populous metros the brokerage tracks.
The numbers
- Median sale price: $389,601, down 0.1% year over year
- Median asking price: $400,703, up 1.2% (seasonally adjusted)
- Median monthly mortgage payment: $2,786 at a 7.32% rate, up 10.7%. Redfin said that is the highest in its records except the prior week.
- Pending sales: 276,352, down 15.9% from a year earlier and 1.8% from the prior week, a record low
- New listings: 352,421, down 4% year over year and 0.6% week over week, the lowest since January
- Active listings: 1,510,619, up 2.2% year over year and 0.3% week over week
- Months of supply: 4.5, up from 4. Redfin considers 4 to 5 months balanced.
- Share of listings with a price cut: 21.5%, up from 20.9%
- Median days on market: 50
- Homes sold above list price: 23.2%, unchanged; average sale-to-list ratio 98.3%, unchanged
Prices are falling because payments aren’t
The report shows the two halves of affordability moving in opposite directions. Prices have stopped rising, but the typical buyer’s monthly payment is up more than 10% from a year ago because rates are much higher. Redfin’s weekly average mortgage rate was 7.32%, down from 7.4% a week earlier but, in Redfin’s words, “still near a three-year high.” Freddie Mac’s survey, released the same day, put the 30-year average at 7.24% for the week ending Oct. 29, compared with 6.17% a year earlier.
Redfin said payments at their second-highest level on record are “spooking would-be buyers.” Sellers are reacting too. New listings fell to their lowest level since the start of the year, which Redfin attributed to homeowners responding to slow demand. Even so, supply is inching up because pending sales are falling faster than new listings. Redfin said there are “hundreds of thousands more home sellers than buyers nationwide, giving buyers more negotiating power than they’ve had in over a decade.”
Where prices are moving
Among the 50 largest metros, the biggest annual price gains were in San Francisco (15%), New Brunswick, N.J. (8.4%), Pittsburgh (7.4%), Montgomery County, Pa. (6.2%) and Cleveland (4.9%). The biggest declines were in Seattle (-5.1%), San Jose, Calif. (-4.9%), Austin, Texas (-4.6%), Kansas City, Mo. (-4.3%) and Nashville, Tenn. (-3.3%).
The split between the two Bay Area markets and Seattle continues a pattern RealtyWire noted in September, when San Francisco prices were rising while Seattle’s slid. Seattle also posted the steepest drop in pending sales, down 31.6% from a year earlier. Atlanta (-25.9%), San Diego (-25.3%), Las Vegas (-22.7%) and Denver (-22.3%) followed.
New listings rose most in San Jose (17.9%), Newark, N.J. (14.4%), Boston (12.8%), Nashville (9.1%) and San Francisco (8.5%). They fell most in Atlanta (-26.5%), San Antonio (-18.7%), Dallas (-17.6%), Austin (-12.9%) and Minneapolis (-8%). Austin appears on both lists, with prices down 4.6% and new listings down 12.9%.
How this squares with other price measures
Redfin’s weekly series is a fast read based on homes sold in the latest four weeks across more than 900 metros, and Redfin notes it is subject to revision. Slower-moving measures still show modest gains. The National Association of Realtors reported earlier on Oct. 29 that prices rose in 78% of metros in the third quarter, with the national median at $432,900. The two are not directly comparable: NAR’s figure is a quarterly median of existing-home sales, while Redfin’s is a rolling four-week figure that runs through late October.
On our reading, the weekly data show that buyers’ sensitivity to payments is finally reaching prices, at least at the national median. A 0.1% decline is a flat market, not a slump, and the metro list shows that the national number masks gains of roughly 5% to 15% in several Northeast, Midwest and Bay Area markets. Whether the decline deepens will depend largely on rates: the payment, not the price, is what has been setting the limit for buyers. Earlier this month, RealtyWire reported pending sales dropping in every major metro as 14.5% of deals fell through. More data coverage is on RealtyWire’s housing market page.