Existing-home sales fell 2.0% in August to a seasonally adjusted annual rate of 3.98 million, the National Association of Realtors said in its Existing-Home Sales report released Sept. 10. It is the first month since June 2025 that resale activity has run below the 4 million mark. Sales were also down 1.2% from August 2025.
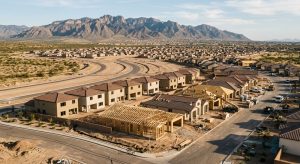
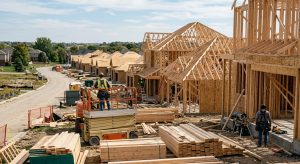
The slowdown arrived alongside the largest supply of homes on the market in nearly seven years, a combination that hands buyers leverage they have not had in this cycle.
Total housing inventory stood at 1.62 million units at the end of August, up 3.2% from July and 5.9% from a year earlier. NAR said it was the first time since November 2019 that inventory topped 1.6 million units. At the current sales pace, that stock equals 4.9 months of supply, up from 4.6 months in July and 4.6 months in August 2025.
“The number of months it would take to exhaust the total inventory at the current sales pace has grown to 4.9 months’ supply — its highest level in over ten years,” NAR Chief Economist Lawrence Yun said in the release. “The ample supply of homes for sale on the market is giving homebuyers better opportunities to negotiate.”
Prices keep climbing as sales slip
Prices have not yet responded to the heavier inventory. The median existing-home price for all housing types was $429,100 in August, up 1.6% from $422,400 a year earlier. That marked the 38th consecutive month of year-over-year price increases, according to the association.
Yun tied the sales dip to borrowing costs rather than to any collapse in demand. “Mortgage rates and home sales move in opposite directions, so it’s not surprising to see a mild dip in home buying activity due to high mortgage rates,” he said. “Still, home prices are rising, and existing home sales are actually up 1.6% year-to-date through the first eight months of the year.”
He credited the labor market for holding the floor under sales, citing 3.1% wage growth in August and 643,000 net new jobs added since the start of the year. “Job creation and wage growth typically drive housing demand,” Yun said.
The average 30-year fixed mortgage rate ran 6.67% in August, according to Freddie Mac figures cited in the report, up from 6.54% in July and 6.59% a year earlier. RealtyWire reported last month that pending home sales slid to a 2026 low in July as rates pushed toward their highest levels of the year, a signal that fed through to August closings.
Every region except the West lost ground
Sales held steady month-over-month only in the West. The Northeast fell 4.0% to an annual rate of 480,000, down 2.0% from August 2025, with a median price of $556,900, up 4.3% year over year. The Midwest dropped 3.1% to 940,000, down 2.1% from a year ago; its median price of $340,400 rose 3.3%.
The South, the largest region by volume, declined 1.6% to 1.84 million but was unchanged from August 2025. Its median price of $366,500 was up just 0.7% year over year, the weakest price gain of any region with an increase. The West was flat at 720,000, down 2.7% from a year earlier, and was the only region where prices fell, with a median of $619,100, down 0.2%.
Single-family sales fell 1.9% to an annual rate of 3.62 million, down 1.1% from August 2025, at a median price of $434,800, up 1.7%. Condominium and co-op sales dropped 2.7% to 360,000, also down 2.7% year over year, at a median of $371,600, up 1.5%.
First-time buyers gain a little room
NAR’s Realtors Confidence Index found properties sat on the market a median of 31 days in August, up from 29 days in July and unchanged from August 2025. First-time buyers accounted for 30% of sales, up from 29% in July and 28% a year ago.
Investor participation kept shrinking. Individual investors and second-home buyers made up 15% of transactions, up from 14% in July but well below the 21% share recorded in August 2025. All-cash sales were 27%, up from 26% in July and down from 28% a year earlier. Distressed sales — foreclosures and short sales — held at 2%, unchanged both from July and from a year ago.
NAR’s Housing Affordability Index registered 104.7 in August, up from 101.2 a year earlier, with year-over-year improvement in all four regions. The South gained 4.5% and the West 5.9%, while the Northeast improved just 0.5%.
On our reading, the August figures describe a market where bargaining power is shifting faster than the price data suggests. Supply is rebuilding toward pre-pandemic levels and closings have slipped below a threshold last crossed more than a year ago, yet the median sale price has now risen on an annual basis for more than three straight years. That gap between negotiating conditions and headline prices is the central tension in the resale market heading into the fall.
The August report follows July’s 1.7% decline to a 4.06 million annual rate, when the median price set a record. More coverage of resale trends and inventory is collected on RealtyWire’s Housing Market page.