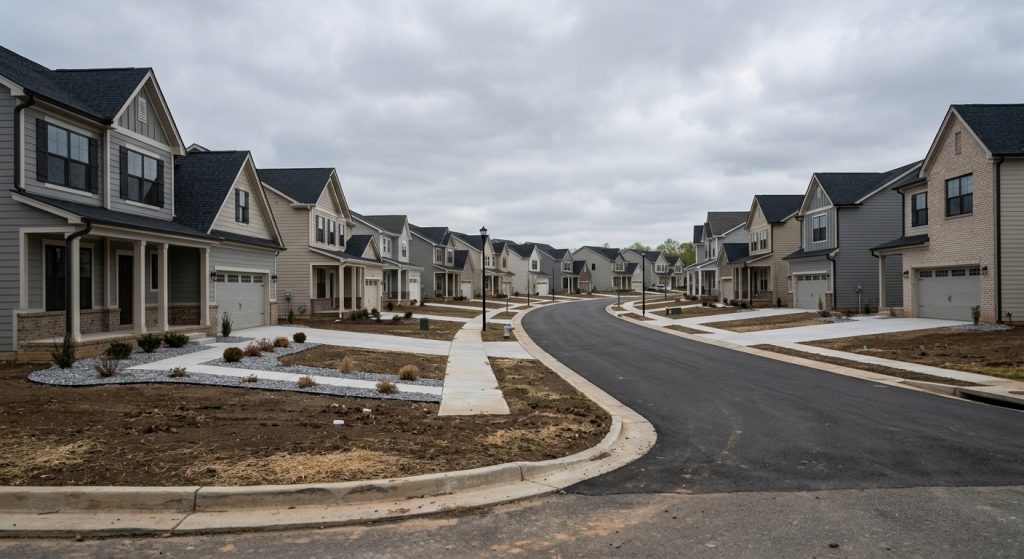
Sales of new single-family homes fell to a seasonally adjusted annual rate of 607,000 in July, down 10.5% from June and 6.3% below a year earlier, the U.S. Census Bureau and the Department of Housing and Urban Development reported jointly on Tuesday. The slide left the new-home market running at its slowest pace since January and pushed the supply of unsold houses to 9.6 months.
Neither headline decline is statistically significant, a caveat that matters for how much weight the numbers can carry. The 10.5% monthly drop carries a 90% confidence interval of plus or minus 14.0 percentage points, and the 6.3% annual decline a margin of plus or minus 19.6 points. Because both ranges include zero, the Census Bureau cannot say with confidence that sales fell at all.
One number in the release does clear that bar, and it is the sharpest in the report: the Midwest.
Midwest new-home sales cut in half
New-home sales in the Midwest ran at an annual rate of 43,000 in July, down 42.7% from June’s 75,000 and down 50.6% from the 87,000 rate recorded in July 2025. Both moves are statistically significant, with confidence intervals of plus or minus 13.4 and 10.6 percentage points respectively. It is the only region in the report where the change is clearly real rather than survey noise.
The other three regions moved within their margins of error. The South, which accounts for roughly two-thirds of all new-home sales, fell 13.0% to a 383,000 rate. The West rose 6.2% to 138,000. The Northeast — the smallest and most volatile region, with a monthly margin of error of nearly 84 percentage points — rose 30.3% to 43,000, matching the Midwest in absolute terms for the first time in the published series.
Year to date, builders have sold an estimated 390,000 new houses, down 4.1% from 407,000 over the same period in 2025. That change is also inside the margin of error.
Inventory keeps building
The clearest signal in the data is on the supply side. The seasonally adjusted count of new houses for sale at the end of July was 488,000, up 1.9% from June — a small move, but one of the few in the release that is statistically significant, with a margin of just 1.2 percentage points. Inventory remains 1.6% below the 496,000 houses on the market in July 2025.
At July’s sales pace, that stock represents 9.6 months of supply, up from 8.5 months in June and 9.2 months a year ago. Six months is the level the industry has historically treated as a balanced market.
The composition of that inventory has shifted. Of the 488,000 houses for sale, 115,000 had not been started, 256,000 were under construction and 117,000 were finished. The not-started share has risen from 96,000 a year earlier, while completed spec homes — the inventory that costs builders the most to carry — edged down from 120,000.
The pullback in sales follows a weak construction report earlier this month, when single-family housing starts plunged in July even as permits climbed, and comes as builders continue to absorb cost pressure. Smaller builders in particular have reported material cost increases several times those paid by the largest firms.
Median price down, average price up
The median sales price of a new house sold in July was $393,800, down 2.3% from June’s $403,100 and down 0.9% from $397,300 a year earlier. The average sales price moved the other way, rising 4.1% on the month and 5.4% on the year to $508,800.
That divergence reflects the mix of what sold. Of the roughly 50,000 houses sold in July on an unadjusted basis, 17,000 were priced between $300,000 and $399,999 and 9,000 sold below $300,000 — but 3,000 changed hands at $1 million or more, holding the top of the market’s share of sales steady while the middle thinned out.
What it means
The verified facts are narrow: inventory rose, months’ supply rose, and Midwest sales fell sharply. Everything else in the July report sits inside the survey’s margin of error.
The Census Bureau’s own guidance is explicit on this point. It takes four months of data to establish a trend in new home sales, the agency notes in the release, and preliminary seasonally adjusted sales estimates are revised by about 5.0% on average. June’s figure was itself revised in this report.
RealtyWire’s reading: the July drop is best treated as a single noisy month rather than a break in trend, but the supply build is harder to dismiss. Months’ supply has now sat at or above 8.5 for every month of 2026, and an inventory increase that clears the significance test while sales do not is the more durable of the two signals in this release.
The Midwest figure is the one to watch. A 50% year-over-year decline in a region that was selling homes at an 87,000 annual rate last July is large enough to survive the margin of error, and whether it persists in the August report will show whether it reflects a genuine regional break or a one-month distortion in a small sample.
The August new residential sales report is scheduled for release on Sept. 24. Full tables for July are available from the Census Bureau’s New Residential Sales program, and more coverage of national sales and price data is collected on RealtyWire’s Housing Market page.