Housing affordability deteriorated in the second quarter of 2026, with a typical family needing 34% of its income to cover the mortgage on a median-priced new home, up from 32% in the first quarter, according to the National Association of Home Builders/Wells Fargo Cost of Housing Index released Thursday.
The decline reversed three consecutive quarters of improvement. The NAHB attributed the setback to higher mortgage rates, rising construction costs and broader economic uncertainty that together weighed on the market.
The numbers
The index measures the share of a family’s income needed to make the mortgage payment on a median-priced home, based on standard underwriting assumptions. A reading above 30% is generally considered cost-burdened.
For a new home, the median price rose to $410,700 in the second quarter, up about 2% from $403,200 in the first quarter. Against a median household income of $106,800, a typical family needed 34% of earnings to afford the payment. Low-income families — those earning half the median — would need 67% of their income to buy the same home.
Existing homes were even less affordable. The median price of an existing home climbed to $434,900, up 8% from $404,300 in the first quarter, pushing the share of income required to 36%. For low-income families, buying a typical existing home would consume 71% of earnings.
Driving the shift was the cost of financing. The 30-year fixed mortgage rate averaged 6.51% in the second quarter, up from 6.20% in the first — a move that raised monthly payments even as incomes rose only modestly. Mortgage rates have remained elevated since, with Freddie Mac’s weekly survey showing the 30-year fixed at 6.65% for the week ending Aug. 20.
A wide gap between metros
Affordability varied sharply across the country. Of the 175 metropolitan areas the NAHB analyzed, 90 were considered affordable, with a typical family needing 30% or less of income to buy a median-priced home. Another 77 were cost-burdened, requiring 31% to 50% of income, and eight were severely cost-burdened, requiring more than half.
San Jose, California, was the least affordable market in the country, where buying a typical home required 82% of a family’s income. Decatur, Illinois, was the most affordable, at 16%. The spread underscores how national averages mask enormous differences between high-cost coastal metros and lower-cost markets in the Midwest and interior.
Pressure on builders and buyers
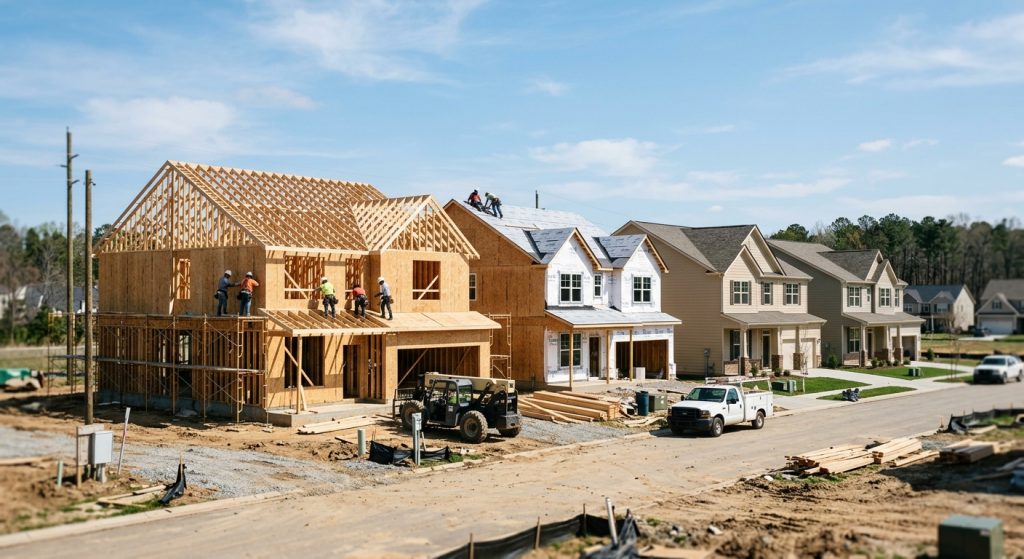
The report lands as builder sentiment has stayed near multi-year lows and construction activity has cooled. Higher financing costs weigh on both sides of the market: they raise the monthly payment for buyers while increasing the cost of the construction and development loans builders rely on. Rising materials and land costs have added further pressure, and homebuilders have said competition for developable land — including from data center developers — has pushed prices higher in some markets.
Affordability constraints help explain why home sales have softened through the summer even as some measures of for-sale inventory have edged up. Many prospective buyers remain priced out at current rates, while existing owners holding low-rate mortgages have little incentive to sell and trade into a more expensive loan. Separate research has pegged the income needed to afford a typical U.S. home near a record $110,000.
What it means: The second-quarter reversal is a reminder that this year’s modest affordability gains were fragile and heavily dependent on the direction of mortgage rates. With rates only slightly off their 2026 highs and prices still rising in much of the country, meaningful relief for buyers likely requires either a sustained drop in financing costs or slower price growth — neither of which is assured. The metro-level divergence also suggests that where a buyer looks matters as much as when, with affordable markets increasingly concentrated away from the largest job centers.
The Cost of Housing Index is published quarterly by the NAHB in partnership with Wells Fargo. The figures reflect median prices and standard underwriting assumptions and do not capture the full range of loan terms, down payments or local tax and insurance costs that affect what an individual buyer pays.